West Plains Light Industrial Land
Opportunity Zone Property
$1.25/SF or $729,000
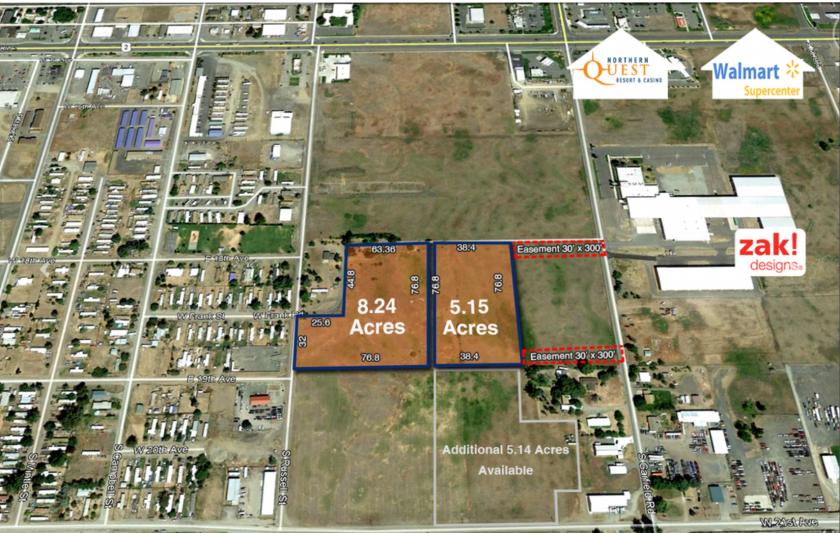
13.39 Acres
Additional adjacent land for sale is also available for Sale
An additional 30 + acres can be assembled
Highlights
Seller will sell on owner carry contract with 30% down
• Located on Russell Street just South of Hwy 2
• Additional Adjacent Land Available for Sale - Call Listing Agent for details
• 270' of Frontage on Russell Road
• Easement (access) to Garfield Road
• Sewer is located and accessible in Russell Road
• Water is located and accessible in Russell Road
• Electrical and Gas are provided by Avista
No part of this information may be copied, reproduced, repurposed, or screen-captured for any commercial purpose without prior written authorization from MyEListing.
While we strive to provide the most accurate information, all listing information, and demographic data, is provided by third-parties. As such, MyEListing will not be responsible for the accuracy of the information. It is strongly recommended that you verify all information with the listing agent, and any relevant agencies, prior to making any decisions.
What is the asking price for 1906 S Garfield Rd in Airway Heights?
The asking price for 1906 S Garfield Rd is $729,000
How much land does the Airway Heights, WA property at 1906 S Garfield Rd include?
1906 S Garfield Rd in Airway Heights includes 13.390 acres of land
What kind of Land is the propery at 1906 S Garfield Rd?
The property at 1906 S Garfield Rd Airway Heights, WA 99001 is listed as a Mixed Use Land Land property
What is the population within 1 mile of 1906 S Garfield Rd in Airway Heights?
The population within 1 mile of 1906 S Garfield Rd Airway Heights, WA 99001 is 1,476 people.
Who do I contact for questions about 1906 S Garfield Rd?
You should contact the listing agent,
Guy Byrd, for any details regarding this commercial listing.