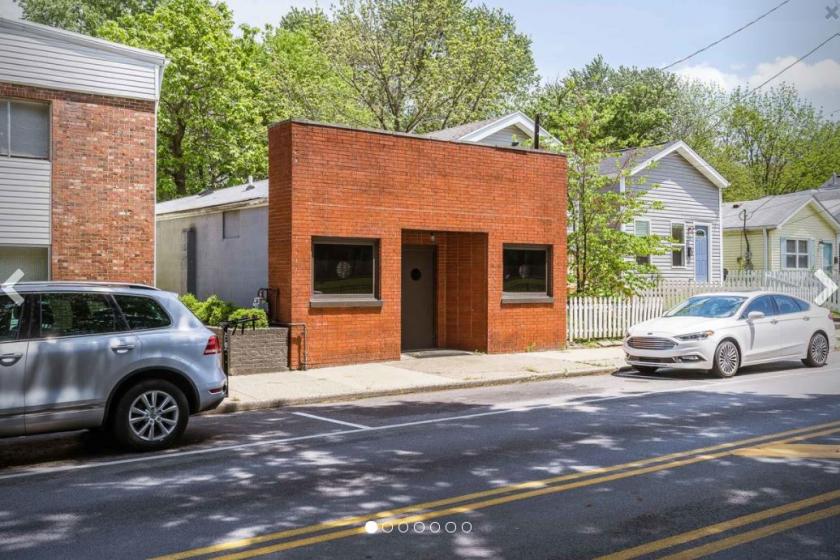
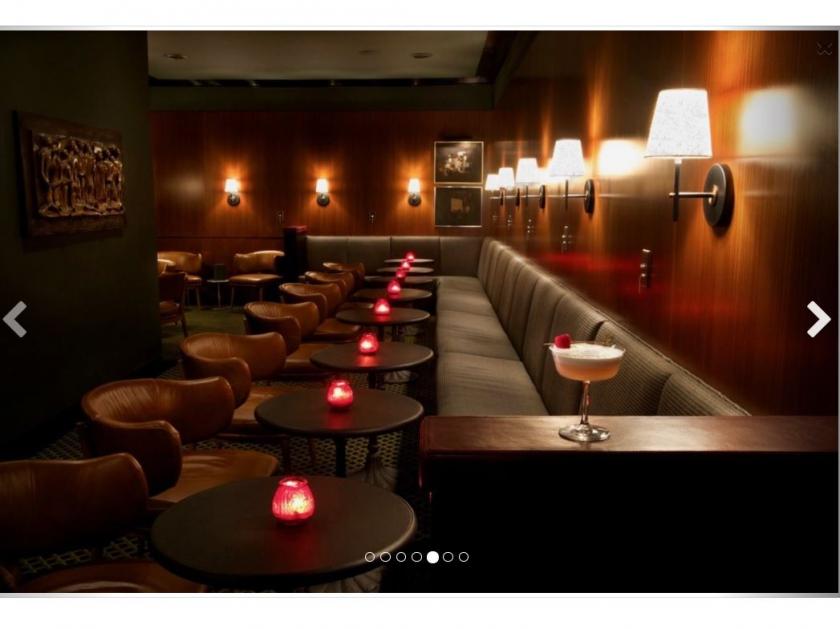
Now available for lease, this former high-end bar/cocktail lounge is located in the heart of Germantown on Goss Avenue directly across the street from the recently redeveloped Germantown Mill Lofts. Formerly known as "Mr. Lee's", this space comes with the very high-end finishes and furnishings that Mr. Lee's was know for. A user will also enjoy the benefit of the equipment, which is less than 5 years old and in great condition.
This is an excellent opportunity for a restaurateur/bar owner seeking a turn-key bar/lounge with very high-end finishes in the popular, and growing, Germantown neighborhood.
Highlights include:
:: Fully Furnished and Equipped former Bar/Cocktail Lounge
:: Nearly 3,800 SF available (approx. 2,200 finished)
:: Dense residential area with growing popularity
:: Located near many other popular bars/restaurants, including The Post, Pearl, Eiderdown, Monnik, Check's and Four Pegs
:: Directly across the street from Class A "Germantown Mill Lofts" apartments
No part of this information may be copied, reproduced, repurposed, or screen-captured for any commercial purpose without prior written authorization from MyEListing.
While we strive to provide the most accurate information, all listing information, and demographic data, is provided by third-parties. As such, MyEListing will not be responsible for the accuracy of the information. It is strongly recommended that you verify all information with the listing agent, and any relevant agencies, prior to making any decisions.
What is the asking price for 935 Goss Avenue in Louisville?
The asking price for 935 Goss Avenue is $9.55 a SF per Year
What is the building size of this commercial Retail property?
The size of this lease property at '.935 Goss Avenue.' is 3769 square feet
What kind of Retail is the propery at 935 Goss Avenue?
The property at 935 Goss Avenue Louisville, KY 40217 is listed as a Free Standing Building Retail property
What is the population within 1 mile of 935 Goss Avenue in Louisville?
The population within 1 mile of 935 Goss Avenue Louisville, KY 40217 is 19,229 people.
Who do I contact for questions about 935 Goss Avenue?
You should contact the listing agent,
Taylor Thompson, for any details regarding this commercial listing.