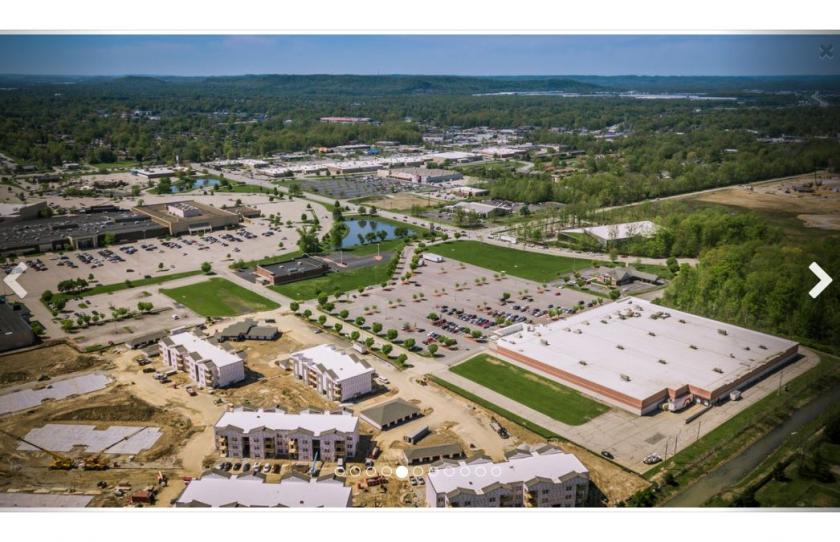
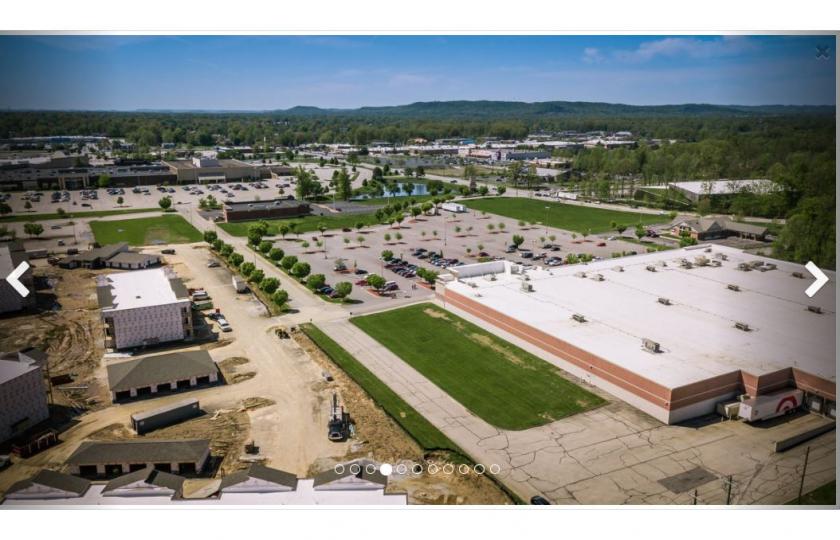
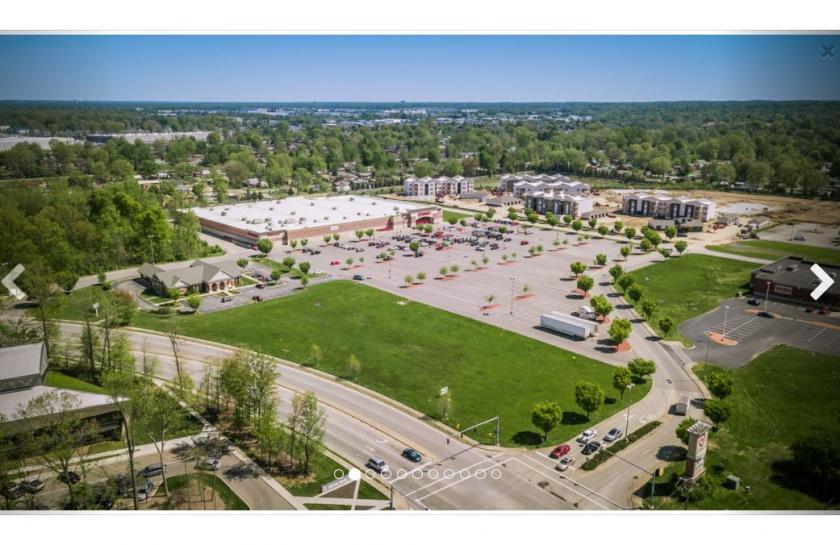
Commercial Land
7397 Jefferson Boulevard Louisville, KY 40219
7397 Jefferson Boulevard Louisville, KY 40219
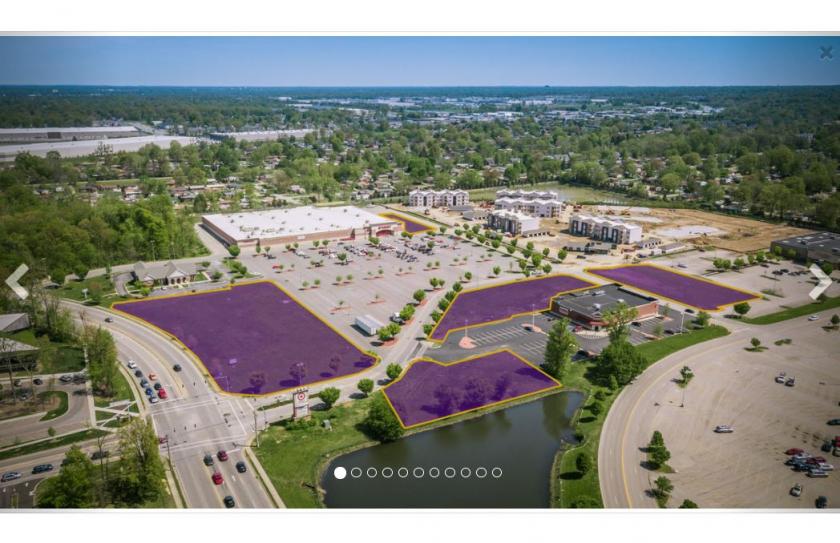
Details & Description
Additional Photos
Listing Agents

Taylor Thompson
O: 502-365-3840
M: 502-649-8616
taylor@prginvestments.com
O: 502-365-3840
M: 502-649-8616
taylor@prginvestments.com
While we strive to provide the most accurate information, all listing information, and demographic data, is provided by third-parties. As such, MyEListing will not be responsible for the accuracy of the information. It is strongly recommended that you verify all information with the listing agent, and any relevant agencies, prior to making any decisions.


