Industrial Properties
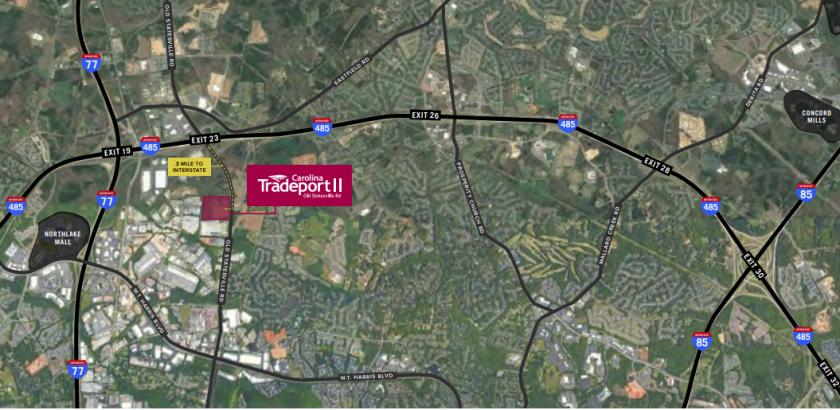
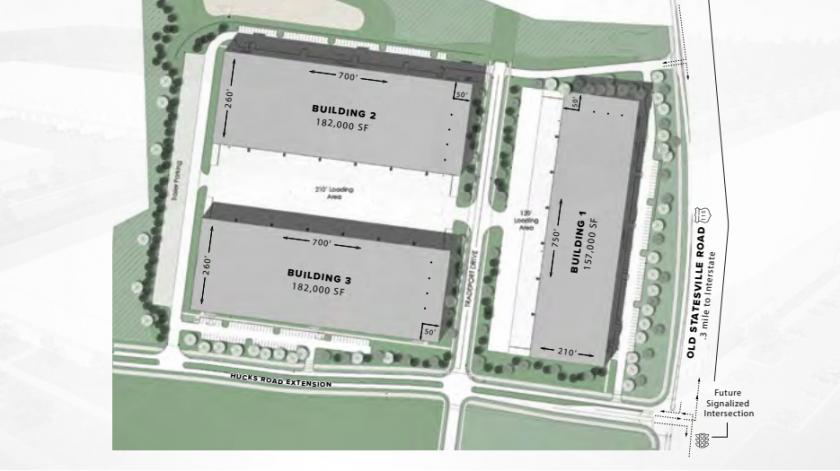
9917 Old Statesville Road Charlotte, NC 28269
9917 Old Statesville Road Charlotte, NC 28269

Details & Description
Listing Agents

Terry Brennan
O: 704-295-0452
tjb@trinity-partners.com
O: 704-295-0452
tjb@trinity-partners.com
While we strive to provide the most accurate information, all listing information, and demographic data, is provided by third-parties. As such, MyEListing will not be responsible for the accuracy of the information. It is strongly recommended that you verify all information with the listing agent, and any relevant agencies, prior to making any decisions.