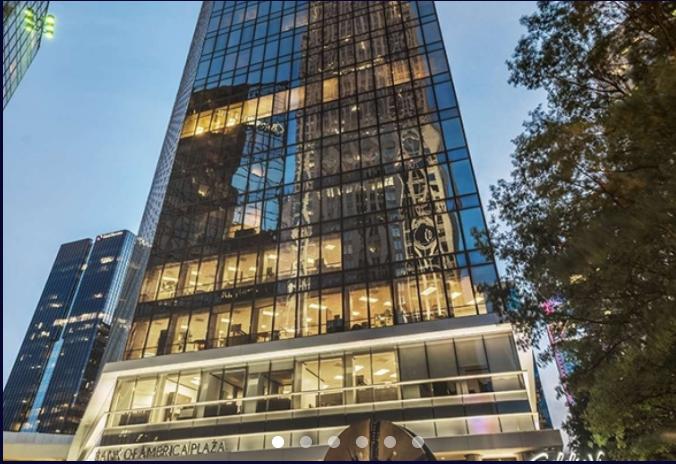
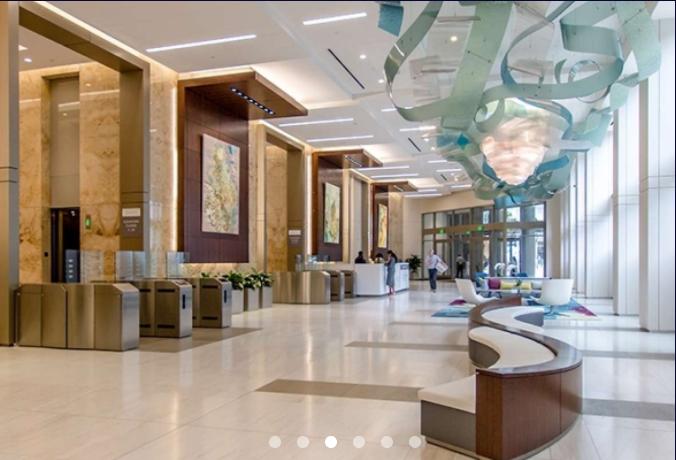
Bank of America Plaza is now One South at The Plaza: a 40-story Class-A office tower at downtown Charlotte's most notable address: Trade and Tryon. One South offers the most coveted, visible signage and naming rights in the city and over 350,000 SF of space across 16 floors, ideal for a corporate headquarters. Recruit and retain top tier employee talent by surrounding them with everything that makes Charlotte a world-class city.22,000 SF typical floor plateCovered parking via two attached garagesDirect covered access to the LYNX light rail stationConnected to the Charlotte Athletic Club, the Omni Hotel and Overstreet Mall's restaurants, retail, and servicesOn-site retail includes Starbucks, Eddie V's, Essex, Tupelo Honey, and Devon & BlakelyClick here to explore the possibilities with interactive space tours that feature views of the city and furniture layout options from standard to socially-distanced to furniture-free.Click links below to tour space through our Matterport tours.18th Floor19th FloorSuite 2010Suite 2450AVAILABILITIES3rd Floor – 22,104 RSF4th Floor –22,139 RSF5th Floor – 22,139 RSF6th Floor – 22,141 RSF7th Floor – 22,139 RSF8th Floor – 22,123 RSF9th Floor – 22,140 RSF10th Floor – 22,139 RSF11th Floor – 22,138 RSF12th Floor – 22,138 RSF14th Floor – 22,132 RSF15th Floor – 22,140 RSF16th Floor – 22,140 RSF17th Floor – 22,140 RSF18th Floor – 22,139 RSF19th Floor – 22,139 RSF20th Floor – 22,139 RSFSuite 2010 - 6,975 RSFSuite 2110 – 5,696 RSFSuite 2450 – 3,181 RSFSuite 2555 - 2,626 RSFSuite 2560a – 522 RSFSuite 2600 – 5,411 RSFDetailsSize891,000 sq ftTotal Available375,664 sq ftMin Available2,626 sq ftMax Contiguous353,158 sq ftLease Rate$36.00-$40.00Websitehttp://www.onesouthattheplaza.comVideoView Video