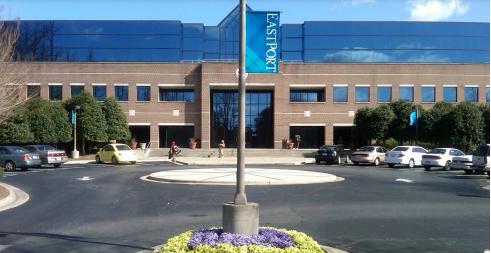
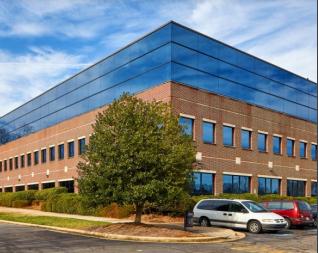
VALUE-ADD OFFICE INVESTMENT OPPORTUNITYTrinity Partners, on behalf of the Owner, is pleased to serve as the exclusive advisor for the sale of Eastport; an opportunity for investors or corporate users to acquire a partially leased office building for significantly below replacement cost, and increase property value by complementing the established tenants with new leases or occupancy. The property is situated in the Triad Region, just over an hour drive from both Charlotte and Raleigh-Durham (Triangle Region), with direct access and exceptional visibility from the heavily trafficked (120,000 VPD) corridor that merges Interstates 40 and 85. This best-in-class building in the East Greensboro submarket was originally built for AT&T and has since been renovated for the existing tenants and former tenant Willis RE. Unique features include open floor plates with wrap-around glass for abundant natural light, along with a state-of-the-art infrastructure including significant fiber and redundant power solutions. Notable employers occupying adjacent properties include General Dynamics and LabCorp, and nearby large scale development is underway to accommodate Publix and American Express.DetailsSize146,850 SF sq ftYear Built1990Sales RateCall for process + detailsAcreage11.36 acres acres