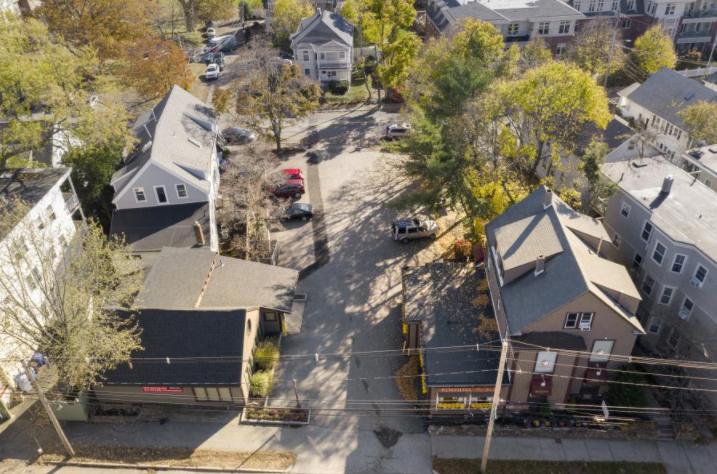
Located in the heart of Chestnut Hill, across the street from the Longwood Cricket Club and within walking distance to the Chestnut Hill Green Line T Station, 128 CRE is pleased to present the opportunity to purchase or lease 1154-1160 Boylston Street in Brookline, MA.
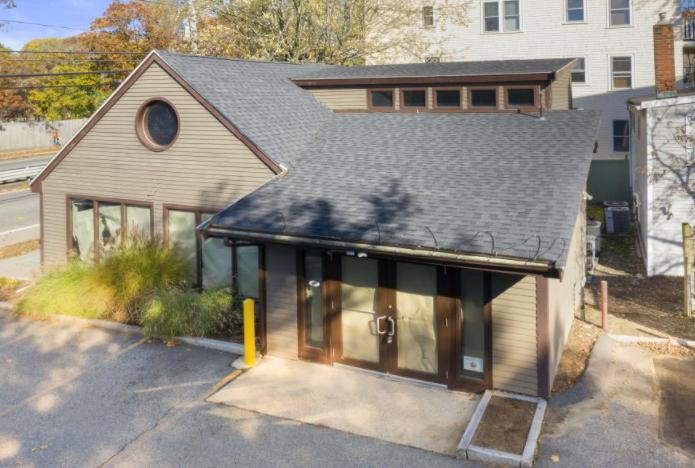
Within two and a half miles west of Boston, 1154-1160 Boylston Street presents owner users with a great opportunity to purchase an income producing property while occupying 1,589 SF at 1154 Boylston Street. This site provides strong economics with future development upside.
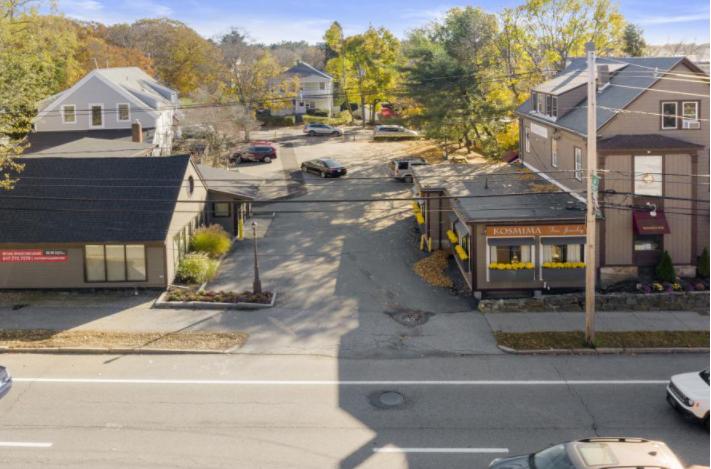
Situated on the eastbound side of Route 9. 1154-1160 Boylston Street offers unmatched visibility with over 142ft. of frontage, and allows investors to benefit from strong credit retailers looking to position themselves in close proximity to Chestnut Hill Square and “The Street,” a premier open-air shopping center containing 640,000 square feet of fashion retailers, restaurants and entertainment options.
The buildings at 1154-1160 Boylston Street offer a multitude of acquisition scenarios for prospective buyers:
1. INVESTMENT: Investors looking for a core, stabilized return.
2. FUTURE DEVELOPMENT: Situated in one of the most affluent sub-markets in New England and just steps away from the Chestnut Hill Green Line, this property proves to be an ideal transit-oriented development site.
3. OWNER USERS: Local retail and/or office tenants with long-term confidence in their business looking to stop paying rent and own their own real estate.
No part of this information may be copied, reproduced, repurposed, or screen-captured for any commercial purpose without prior written authorization from MyEListing.
While we strive to provide the most accurate information, all listing information, and demographic data, is provided by third-parties. As such, MyEListing will not be responsible for the accuracy of the information. It is strongly recommended that you verify all information with the listing agent, and any relevant agencies, prior to making any decisions.
What is the building size of this Office property in Brookline, MA?
The size of the building/unit at 1154 Boylston Street in Brookline is 5,289 square feet
How much land does the Brookline, MA property at 1154 Boylston Street include?
1154 Boylston Street in Brookline includes 0.327 acres of land
What kind of Office is the propery at 1154 Boylston Street?
The property at 1154 Boylston Street Brookline, MA 02467 is listed as a Professional Office property
What is the population within 1 mile of 1154 Boylston Street in Brookline?
The population within 1 mile of 1154 Boylston Street Brookline, MA 02467 is 13,454 people.
Who do I contact for questions about 1154 Boylston Street?
You should contact the listing agent,
Jeremy Freid, for any details regarding this commercial listing.