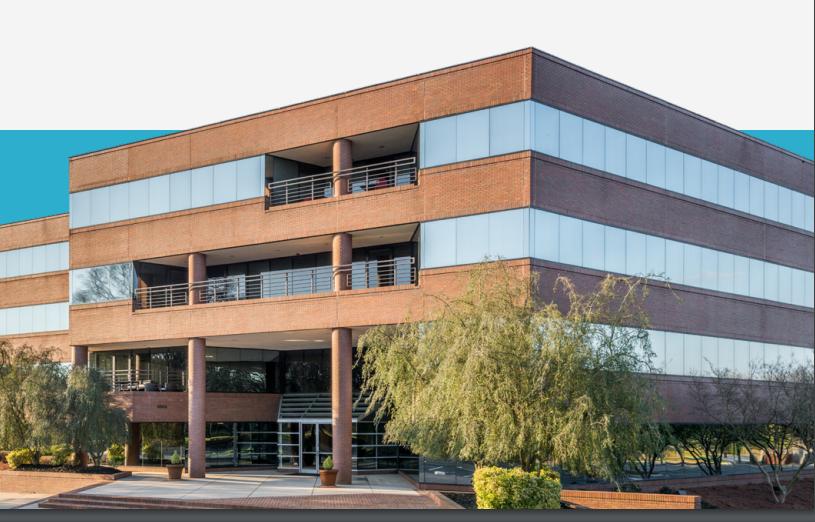
A seven-building office portfolio in Charlotte’s airport submarket, formerly Parkway Plaza.Yorkmont Plaza’s seven buildings feature a range of availabilities in all sizes, starting at 999 SF up to 80,000 SF divided between two vacant adjacent 40,000 SF buildings.Features on-site property management and maintenance, tenant fitness facility, cafe and conference center.Parking Ratio: The park-wide average parking ratio is 4/1,000 RSF. However, parking ratios vary slightly from building to building and the Landlord has the ability to offer an above-average parking ratio to select, high-density tenants via additional vacant parking lots on site.Located in the Airport submarket, Yorkmont Plaza is just off Yorkmont Road and minutes from major interstates, downtown Charlotte, South End, and the airport. Its central location is ideal for employees coming from all over the city. Yorkmont Plaza is a short walk to the popular Charlotte Regional Farmer’s Market and minutes from retail and restaurants at City Park. The portfolio, just across from Billy Graham Parkway, offers prominent traffic visibility and branding opportunities for large tenants.AVAILABILITIESTwo Yorkmont PlazaSuite 150: 12,364 RSFSuite 250: 9,514 RSFThree Yorkmont PlazaSuite 110: 2,094 RSFSuite 120: 4,059 RSF (avail. 4/1/21)Suite 250: 7,042 RSFSuite 350: 2,864 – 3,748 RSFSuite 480: 7,303 RSFSix Yorkmont Plaza100%LeasedSeven Yorkmont PlazaSuite 100: 2,205 rsfSuite 115: 5,667 rsfSuite 150: 1,497 rsfSuite 175: 7,552 rsfEight Yorkmont Plaza1st Floor: 20,600 RSF2nd Floor: 20,600 RSFEleven Yorkmont PlazaSuite 120: 2,311 RSFSuite 170: 1,670 RSF*Suite 180: 3,246 RSF**ContiguousTwelve Yorkmont Plaza100% LeasedDetailsTotal Available378,872 sq ftMin Available999 sq ftLease Rate$22.00