Office Space
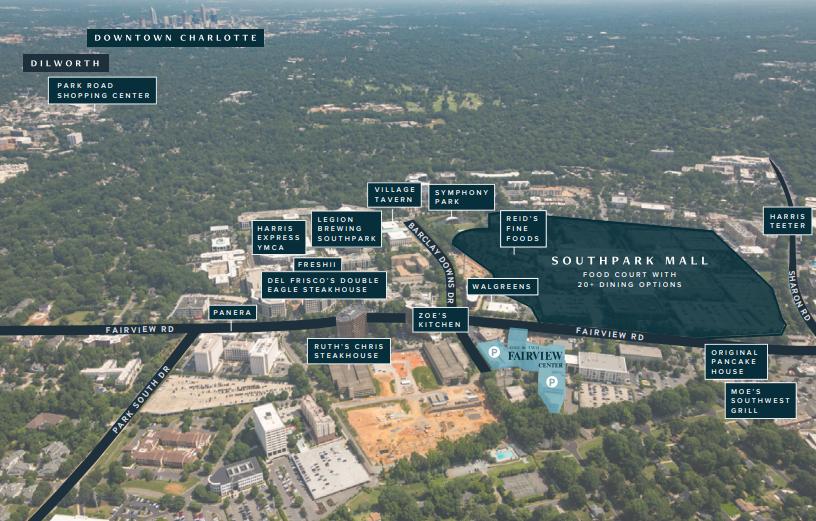
6230 Fairview Road Charlotte, NC 28210
6230 Fairview Road Charlotte, NC 28210
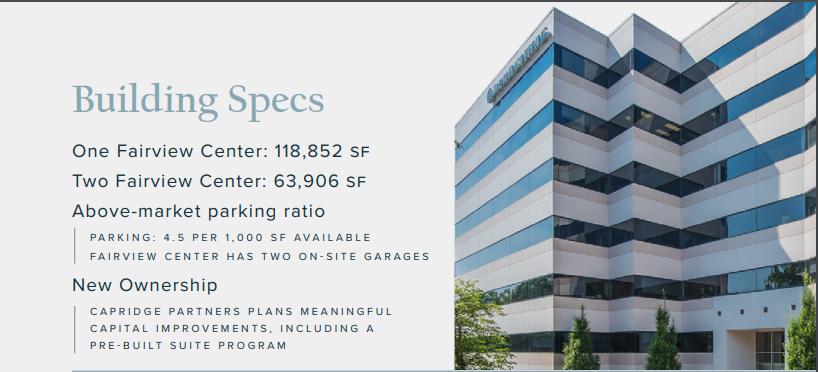
Details & Description
Listing Agents

Maddy Howey
Trinity Partners
O: 704-295-0448
mhowey@trinity-partners.com
Trinity Partners
O: 704-295-0448
mhowey@trinity-partners.com
While we strive to provide the most accurate information, all listing information, and demographic data, is provided by third-parties. As such, MyEListing will not be responsible for the accuracy of the information. It is strongly recommended that you verify all information with the listing agent, and any relevant agencies, prior to making any decisions.