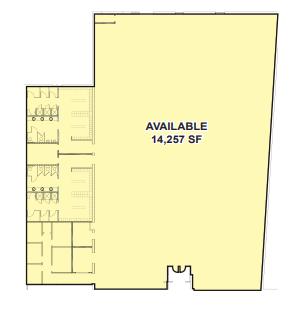
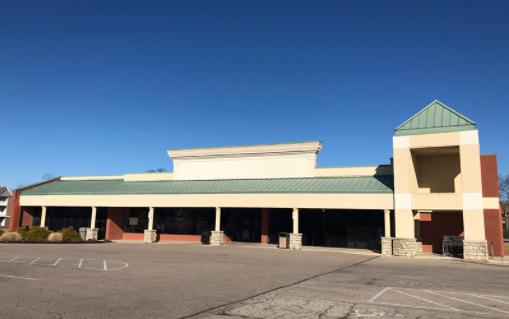
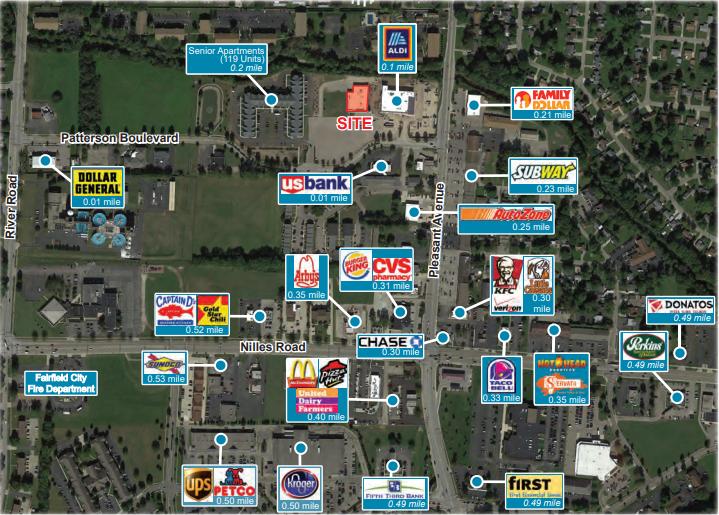
1-Mile | 3-Miles | 5-Miles | ||
---|---|---|---|---|
Total Population | 7,777 | 56,438 | 140,828 | |
Population Median Age | 41 | 38 | 38 | |
Population by Age | 0-9 Yrs | 1056 (13%) | 7287 (12%) | 19074 (13%) |
10-19 Yrs | 858 (11%) | 7406 (13%) | 18334 (13%) | |
20-29 Yrs | 726 (9%) | 7893 (13%) | 20927 (14%) | |
30-39 Yrs | 1130 (14%) | 7404 (13%) | 17977 (12%) | |
40-49 Yrs | 822 (10%) | 6457 (11%) | 16492 (11%) | |
50-59 Yrs | 1071 (13%) | 7607 (13%) | 18720 (13%) | |
60-69 Yrs | 917 (11%) | 6502 (11%) | 16007 (11%) | |
70+ Yrs | 1196 (15%) | 5881 (10%) | 13297 (9%) | |
Median HH Income | $57,197 | $58,695 | $57,547 | |
Total Household Income | < 24K | 531 (16%) | 3915 (17%) | 10726 (20%) |
25-49K | 809 (24%) | 5340 (24%) | 12591 (23%) | |
50-74K | 755 (23%) | 4586 (20%) | 10850 (20%) | |
75-99K | 430 (13%) | 3303 (15%) | 7601 (14%) | |
100-199K | 634 (19%) | 4009 (18%) | 10201 (19%) | |
200K+ | 96 (2%) | 781 (3%) | 1611 (3%) | |
Highest Education Level | No Diploma | 360 | 3829 | 10059 |
Diploma or GED | 1971 | 14125 | 33486 | |
Some College | 1276 | 7362 | 18657 | |
Assoc. Degree | 531 | 3333 | 8303 | |
Bachelors Degree | 1041 | 6624 | 15314 | |
Higher Degree | 382 | 2503 | 6879 | |
Total Housing Units | 3,526 | 24,012 | 58,850 | |
--Owner-Occupied | 2,169 | 13,799 | 32,795 | |
--Renter-Occupied | 1,086 | 8,134 | 20,785 | |
Owner-Occupied Values | < 100K | 225 | 3722 | 9994 |
100-199K | 1591 | 7312 | 15701 | |
200-299K | 263 | 2156 | 5306 | |
300-399K | 40 | 348 | 1163 | |
400-499K | 23 | 120 | 261 | |
500K+ | 27 | 141 | 371 | |
Total Working Age Population | 6,160 | 44,448 | 110,012 | |
In Work Force | 3,832 | 29,665 | 72,273 | |
Not In Work Force | 2,328 | 14,782 | 37,739 | |
Workforce Employed | 3,740 | 28,330 | 68,658 | |
Workforce Unemployed | 92 | 1,322 | 3,535 | |
Civlian Workforce | 3,832 | 29,652 | 72,193 | |
Military Workforce | 0 | 13 | 79 | |
Total Households | 3,255 | 21,933 | 53,579 | |
Family Households | 2,005 | 14,150 | 34,687 | |
Non-Family Households | 1,250 | 7,783 | 18,893 | |
Married Couple | 1,468 | 9,913 | 23,609 | |
Other Family | 537 | 4,238 | 11,077 | |
Married w/Child | 549 | 3,766 | 9,093 | |
Single Male w/Child | 90 | 586 | 1,438 | |
Single Female w/Child | 159 | 1,658 | 4,705 |
Population Change Last Two Decades - Plus Projection
2000 | % | 2010 | % | 2020 | % | 2030 | |
---|---|---|---|---|---|---|---|
Ohio | 11,353,140 | +2 | 11,536,504 | 0 | 11,574,870 | 0 | 11,615,100 |
Butler County | 332,807 | +11 | 368,130 | +6 | 390,110 | +5 | 410,960 |
Hamilton County | 845,303 | -5 | 802,374 | -1 | 790,600 | -1 | 785,900 |
Total Working Age Population:
Total Households:
Total Working Age Population:
Total Households:
Total Working Age Population:
Total Households: