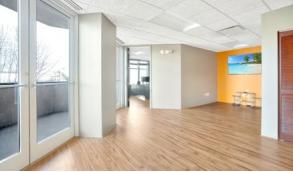
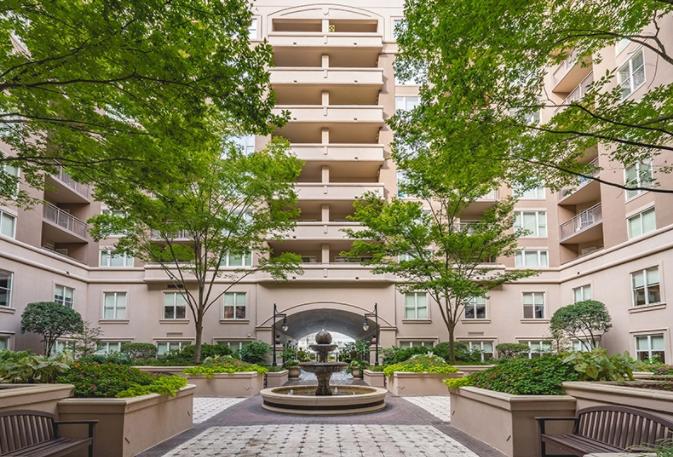
1-Mile | 3-Miles | 5-Miles | ||
---|---|---|---|---|
Total Population | 17,875 | 103,134 | 228,380 | |
Population Median Age | 34 | 35 | 36 | |
Population by Age | 0-9 Yrs | 884 (4%) | 10783 (10%) | 28099 (12%) |
10-19 Yrs | 1079 (6%) | 9984 (9%) | 24663 (10%) | |
20-29 Yrs | 7088 (39%) | 24666 (23%) | 45509 (19%) | |
30-39 Yrs | 3774 (21%) | 20311 (19%) | 41714 (18%) | |
40-49 Yrs | 1743 (9%) | 11257 (10%) | 27134 (11%) | |
50-59 Yrs | 1435 (8%) | 11440 (11%) | 26392 (11%) | |
60-69 Yrs | 1373 (7%) | 8491 (8%) | 19560 (8%) | |
70+ Yrs | 498 (2%) | 6202 (6%) | 15309 (6%) | |
Median HH Income | $93,345 | $68,597 | $56,097 | |
Total Household Income | < 24K | 1308 (13%) | 9702 (20%) | 22336 (22%) |
25-49K | 1197 (12%) | 8483 (17%) | 22195 (22%) | |
50-74K | 1352 (13%) | 7108 (15%) | 15113 (15%) | |
75-99K | 1353 (13%) | 4989 (10%) | 9686 (9%) | |
100-199K | 2742 (28%) | 10285 (21%) | 17893 (18%) | |
200K+ | 1747 (18%) | 6727 (14%) | 10711 (10%) | |
Highest Education Level | No Diploma | 365 | 6234 | 20287 |
Diploma or GED | 769 | 9878 | 26865 | |
Some College | 1240 | 11343 | 28412 | |
Assoc. Degree | 736 | 4062 | 9637 | |
Bachelors Degree | 6055 | 25720 | 46916 | |
Higher Degree | 3767 | 15823 | 26302 | |
Total Housing Units | 11,697 | 54,489 | 110,480 | |
--Owner-Occupied | 2,887 | 19,347 | 41,406 | |
--Renter-Occupied | 6,811 | 27,947 | 56,529 | |
Owner-Occupied Values | < 100K | 60 | 2025 | 6607 |
100-199K | 212 | 2909 | 9562 | |
200-299K | 634 | 3146 | 6474 | |
300-399K | 631 | 2855 | 4903 | |
400-499K | 262 | 1768 | 3240 | |
500K+ | 1088 | 6643 | 10620 | |
Total Working Age Population | 16,552 | 86,517 | 184,814 | |
In Work Force | 13,802 | 64,816 | 133,771 | |
Not In Work Force | 2,750 | 21,702 | 51,043 | |
Workforce Employed | 13,511 | 61,788 | 126,827 | |
Workforce Unemployed | 291 | 3,022 | 6,879 | |
Civlian Workforce | 13,802 | 64,810 | 133,707 | |
Military Workforce | 0 | 5 | 64 | |
Total Households | 9,698 | 47,293 | 97,934 | |
Family Households | 2,612 | 19,327 | 46,232 | |
Non-Family Households | 7,086 | 27,967 | 51,702 | |
Married Couple | 2,214 | 12,756 | 28,884 | |
Other Family | 398 | 6,571 | 17,348 | |
Married w/Child | 654 | 4,789 | 11,541 | |
Single Male w/Child | 43 | 572 | 1,495 | |
Single Female w/Child | 100 | 2,729 | 7,544 |
Population Change Last Two Decades - Plus Projection
2000 | % | 2010 | % | 2020 | % | 2030 | |
---|---|---|---|---|---|---|---|
North Carolina | 8,049,313 | +18 | 9,535,483 | +11 | 10,630,691 | +11 | 11,836,070 |
Cabarrus County | 131,063 | +36 | 178,011 | +22 | 216,608 | +20 | 259,075 |
Gaston County | 190,365 | +8 | 206,086 | +9 | 223,842 | +7 | 239,285 |
Mecklenburg County | 695,454 | +32 | 919,628 | +23 | 1,131,342 | +19 | 1,348,822 |
Union County | 123,677 | +63 | 201,292 | +21 | 242,657 | +25 | 302,410 |
South Carolina | 4,012,012 | +15 | 4,625,364 | +9 | 5,020,400 | +9 | 5,488,460 |
York County | 164,614 | +37 | 226,073 | +12 | 252,860 | +14 | 287,970 |
Total Working Age Population:
Total Households:
Total Working Age Population:
Total Households:
Total Working Age Population:
Total Households: