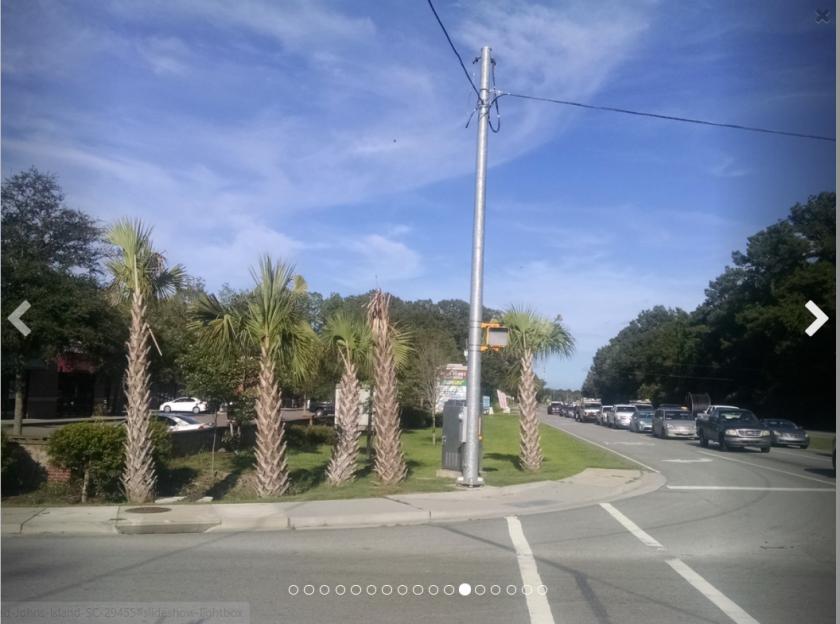
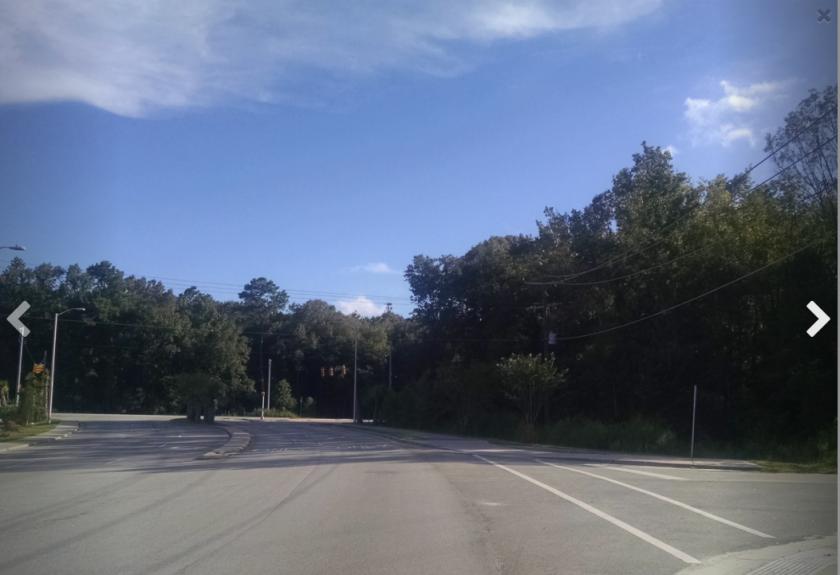
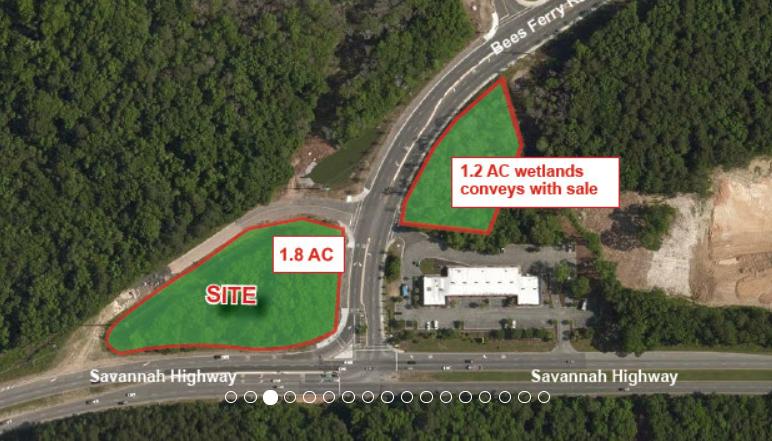
1-Mile | 3-Miles | 5-Miles | ||
---|---|---|---|---|
Total Population | 1,668 | 14,071 | 48,893 | |
Population Median Age | 38 | 39 | 41 | |
Population by Age | 0-9 Yrs | 246 (14%) | 1706 (12%) | 5668 (11%) |
10-19 Yrs | 85 (5%) | 950 (6%) | 3453 (7%) | |
20-29 Yrs | 276 (16%) | 2050 (14%) | 6708 (13%) | |
30-39 Yrs | 355 (21%) | 3066 (21%) | 9729 (19%) | |
40-49 Yrs | 184 (11%) | 1578 (11%) | 4989 (10%) | |
50-59 Yrs | 182 (10%) | 1810 (12%) | 7030 (14%) | |
60-69 Yrs | 187 (11%) | 1641 (11%) | 6050 (12%) | |
70+ Yrs | 152 (9%) | 1271 (9%) | 5267 (10%) | |
Median HH Income | $84,029 | $81,698 | $73,385 | |
Total Household Income | < 24K | 85 (11%) | 689 (11%) | 2966 (14%) |
25-49K | 127 (17%) | 895 (15%) | 3750 (18%) | |
50-74K | 110 (15%) | 1082 (18%) | 3838 (18%) | |
75-99K | 100 (13%) | 1063 (18%) | 3273 (15%) | |
100-199K | 266 (37%) | 1751 (29%) | 5360 (25%) | |
200K+ | 27 (3%) | 422 (7%) | 1433 (6%) | |
Highest Education Level | No Diploma | 21 | 354 | 1549 |
Diploma or GED | 295 | 2357 | 9018 | |
Some College | 220 | 1733 | 6591 | |
Assoc. Degree | 132 | 1072 | 3613 | |
Bachelors Degree | 458 | 3570 | 11422 | |
Higher Degree | 158 | 1657 | 5234 | |
Total Housing Units | 783 | 6,505 | 22,512 | |
--Owner-Occupied | 487 | 3,920 | 13,630 | |
--Renter-Occupied | 228 | 1,982 | 6,991 | |
Owner-Occupied Values | < 100K | 13 | 189 | 927 |
100-199K | 94 | 759 | 2679 | |
200-299K | 252 | 1342 | 4925 | |
300-399K | 110 | 1041 | 3067 | |
400-499K | 15 | 319 | 858 | |
500K+ | 3 | 270 | 1174 | |
Total Working Age Population | 1,376 | 11,707 | 40,988 | |
In Work Force | 1,041 | 8,650 | 28,490 | |
Not In Work Force | 336 | 3,058 | 12,498 | |
Workforce Employed | 1,015 | 8,356 | 27,486 | |
Workforce Unemployed | 16 | 225 | 752 | |
Civlian Workforce | 1,031 | 8,581 | 28,238 | |
Military Workforce | 10 | 69 | 252 | |
Total Households | 715 | 5,902 | 20,621 | |
Family Households | 414 | 3,476 | 11,780 | |
Non-Family Households | 301 | 2,425 | 8,841 | |
Married Couple | 360 | 2,951 | 9,741 | |
Other Family | 54 | 526 | 2,038 | |
Married w/Child | 127 | 1,043 | 3,149 | |
Single Male w/Child | 0 | 61 | 239 | |
Single Female w/Child | 18 | 125 | 500 |
Population Change Last Two Decades - Plus Projection
2000 | % | 2010 | % | 2020 | % | 2030 | |
---|---|---|---|---|---|---|---|
South Carolina | 4,012,012 | +15 | 4,625,364 | +9 | 5,020,400 | +9 | 5,488,460 |
Berkeley County | 142,651 | +25 | 177,843 | +8 | 192,450 | +11 | 214,140 |
Charleston County | 309,969 | +13 | 350,209 | +5 | 366,380 | +6 | 386,660 |
Dorchester County | 96,413 | +42 | 136,555 | +9 | 149,300 | +14 | 170,210 |
Total Working Age Population:
Total Households:
Total Working Age Population:
Total Households:
Total Working Age Population:
Total Households: