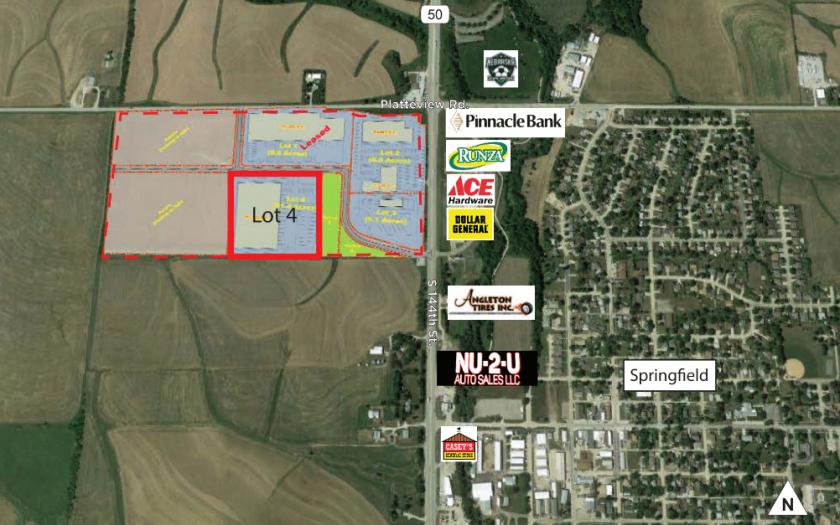
1-Mile | 3-Miles | 5-Miles | ||
---|---|---|---|---|
Total Population | 1,610 | 3,026 | 12,571 | |
Population Median Age | 40 | 41 | 37 | |
Population by Age | 0-9 Yrs | 180 (11%) | 318 (10%) | 1830 (14%) |
10-19 Yrs | 281 (17%) | 502 (16%) | 2129 (16%) | |
20-29 Yrs | 93 (5%) | 187 (6%) | 880 (7%) | |
30-39 Yrs | 207 (12%) | 361 (11%) | 1854 (14%) | |
40-49 Yrs | 236 (14%) | 402 (13%) | 1840 (14%) | |
50-59 Yrs | 194 (12%) | 444 (14%) | 1744 (13%) | |
60-69 Yrs | 233 (14%) | 457 (15%) | 1314 (10%) | |
70+ Yrs | 186 (11%) | 354 (11%) | 979 (7%) | |
Median HH Income | $74,538 | $86,795 | $98,855 | |
Total Household Income | < 24K | 94 (14%) | 125 (10%) | 339 (7%) |
25-49K | 86 (13%) | 158 (13%) | 513 (11%) | |
50-74K | 148 (22%) | 217 (18%) | 670 (14%) | |
75-99K | 104 (15%) | 199 (16%) | 768 (17%) | |
100-199K | 176 (27%) | 366 (30%) | 1674 (37%) | |
200K+ | 42 (6%) | 122 (10%) | 545 (12%) | |
Highest Education Level | No Diploma | 45 | 85 | 306 |
Diploma or GED | 318 | 526 | 1490 | |
Some College | 226 | 480 | 1777 | |
Assoc. Degree | 73 | 151 | 713 | |
Bachelors Degree | 307 | 606 | 2510 | |
Higher Degree | 127 | 248 | 1362 | |
Total Housing Units | 668 | 1,241 | 4,679 | |
--Owner-Occupied | 509 | 1,019 | 3,780 | |
--Renter-Occupied | 141 | 169 | 730 | |
Owner-Occupied Values | < 100K | 44 | 63 | 179 |
100-199K | 272 | 386 | 1112 | |
200-299K | 107 | 210 | 1048 | |
300-399K | 38 | 138 | 661 | |
400-499K | 35 | 141 | 380 | |
500K+ | 14 | 81 | 398 | |
Total Working Age Population | 1,241 | 2,388 | 9,282 | |
In Work Force | 900 | 1,676 | 7,046 | |
Not In Work Force | 341 | 711 | 2,236 | |
Workforce Employed | 887 | 1,636 | 6,758 | |
Workforce Unemployed | 13 | 32 | 162 | |
Civlian Workforce | 899 | 1,669 | 6,920 | |
Military Workforce | 1 | 7 | 126 | |
Total Households | 651 | 1,188 | 4,510 | |
Family Households | 436 | 851 | 3,471 | |
Non-Family Households | 214 | 336 | 1,039 | |
Married Couple | 357 | 742 | 3,050 | |
Other Family | 80 | 109 | 421 | |
Married w/Child | 154 | 289 | 1,388 | |
Single Male w/Child | 8 | 12 | 83 | |
Single Female w/Child | 43 | 50 | 185 |
Population Change Last Two Decades - Plus Projection
2000 | % | 2010 | % | 2020 | % | 2030 | |
---|---|---|---|---|---|---|---|
Nebraska | 1,711,263 | +7 | 1,826,341 | +6 | 1,943,452 | +6 | 2,053,788 |
Cass County | 24,334 | +4 | 25,241 | +2 | 25,774 | 0 | 25,818 |
Sarpy County | 122,595 | +30 | 158,840 | +24 | 196,701 | +19 | 233,688 |
Total Working Age Population:
Total Households:
Total Working Age Population:
Total Households:
Total Working Age Population:
Total Households: