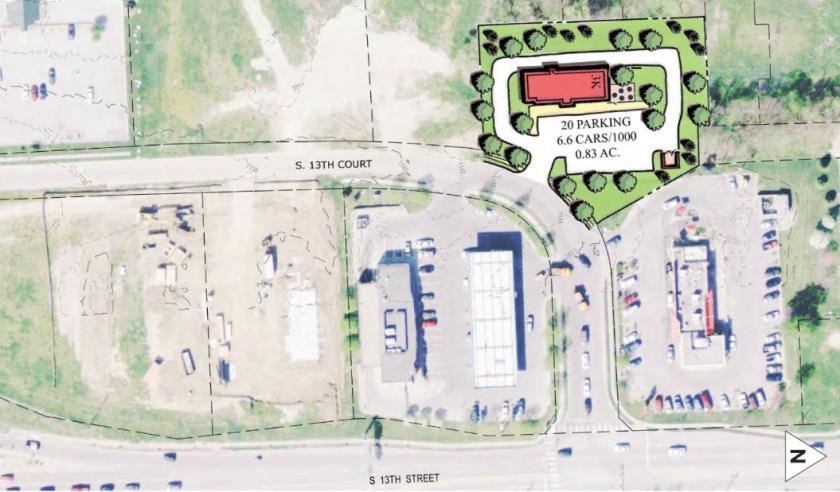
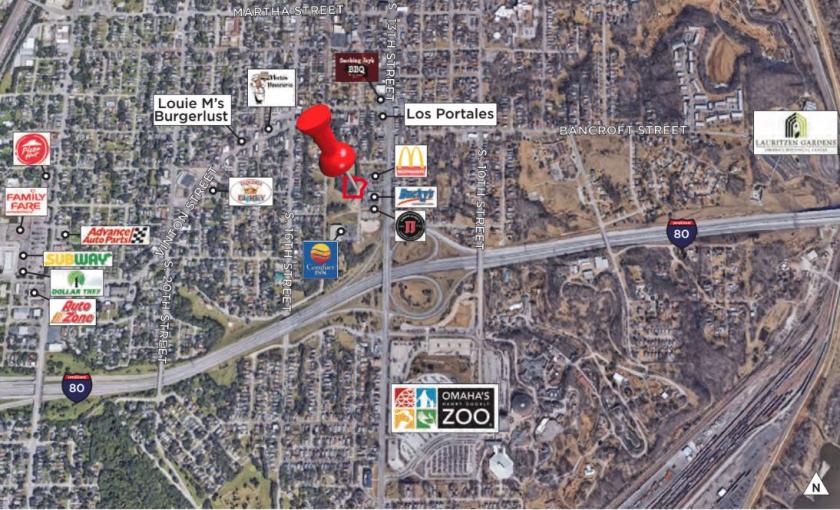
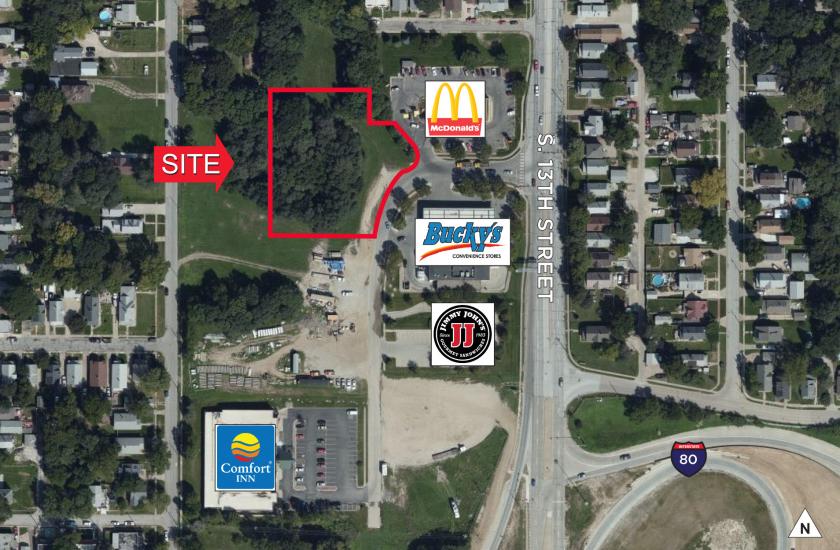
1-Mile | 3-Miles | 5-Miles | ||
---|---|---|---|---|
Total Population | 14,541 | 103,328 | 233,090 | |
Population Median Age | 33 | 34 | 35 | |
Population by Age | 0-9 Yrs | 2548 (17%) | 15165 (14%) | 33303 (14%) |
10-19 Yrs | 2496 (17%) | 14760 (14%) | 32252 (13%) | |
20-29 Yrs | 1989 (13%) | 20648 (19%) | 41915 (17%) | |
30-39 Yrs | 1989 (13%) | 15190 (14%) | 34244 (14%) | |
40-49 Yrs | 1876 (12%) | 11688 (11%) | 26462 (11%) | |
50-59 Yrs | 1824 (12%) | 11523 (11%) | 27115 (11%) | |
60-69 Yrs | 996 (6%) | 8222 (7%) | 20411 (8%) | |
70+ Yrs | 822 (5%) | 6132 (5%) | 17389 (7%) | |
Median HH Income | $41,559 | $45,563 | $49,012 | |
Total Household Income | < 24K | 1415 (29%) | 10628 (27%) | 22149 (24%) |
25-49K | 1351 (28%) | 10468 (26%) | 23336 (26%) | |
50-74K | 1009 (20%) | 7816 (20%) | 17580 (19%) | |
75-99K | 575 (11%) | 4546 (11%) | 11237 (12%) | |
100-199K | 391 (8%) | 4815 (12%) | 12503 (13%) | |
200K+ | 74 (1%) | 767 (1%) | 2633 (2%) | |
Highest Education Level | No Diploma | 3195 | 14743 | 26641 |
Diploma or GED | 2323 | 17060 | 42080 | |
Some College | 1416 | 12160 | 30206 | |
Assoc. Degree | 356 | 4412 | 10719 | |
Bachelors Degree | 944 | 9371 | 23759 | |
Higher Degree | 321 | 5230 | 13201 | |
Total Housing Units | 5,379 | 43,732 | 98,548 | |
--Owner-Occupied | 2,255 | 17,624 | 46,930 | |
--Renter-Occupied | 2,559 | 21,416 | 42,507 | |
Owner-Occupied Values | < 100K | 1325 | 7110 | 16945 |
100-199K | 753 | 8794 | 22265 | |
200-299K | 74 | 918 | 4367 | |
300-399K | 16 | 364 | 1640 | |
400-499K | 15 | 173 | 656 | |
500K+ | 72 | 264 | 1058 | |
Total Working Age Population | 10,483 | 79,933 | 181,483 | |
In Work Force | 7,007 | 54,321 | 123,097 | |
Not In Work Force | 3,475 | 25,613 | 58,385 | |
Workforce Employed | 6,589 | 50,980 | 115,378 | |
Workforce Unemployed | 418 | 3,082 | 7,031 | |
Civlian Workforce | 7,007 | 54,062 | 122,408 | |
Military Workforce | 0 | 258 | 689 | |
Total Households | 4,814 | 39,040 | 89,437 | |
Family Households | 2,976 | 20,257 | 49,919 | |
Non-Family Households | 1,838 | 18,783 | 39,518 | |
Married Couple | 1,896 | 13,371 | 32,441 | |
Other Family | 1,081 | 6,886 | 17,478 | |
Married w/Child | 1,143 | 6,441 | 14,264 | |
Single Male w/Child | 162 | 826 | 2,215 | |
Single Female w/Child | 450 | 3,076 | 7,651 |
Population Change Last Two Decades - Plus Projection
2000 | % | 2010 | % | 2020 | % | 2030 | |
---|---|---|---|---|---|---|---|
Iowa | 2,926,324 | +4 | 3,046,355 | -100 | |||
Pottawattamie County | 87,704 | +6 | 93,158 | -100 | |||
Nebraska | 1,711,263 | +7 | 1,826,341 | +6 | 1,943,452 | +6 | 2,053,788 |
Douglas County | 463,585 | +12 | 517,110 | +10 | 571,311 | +9 | 625,173 |
Sarpy County | 122,595 | +30 | 158,840 | +24 | 196,701 | +19 | 233,688 |
Total Working Age Population:
Total Households:
Total Working Age Population:
Total Households:
Total Working Age Population:
Total Households: