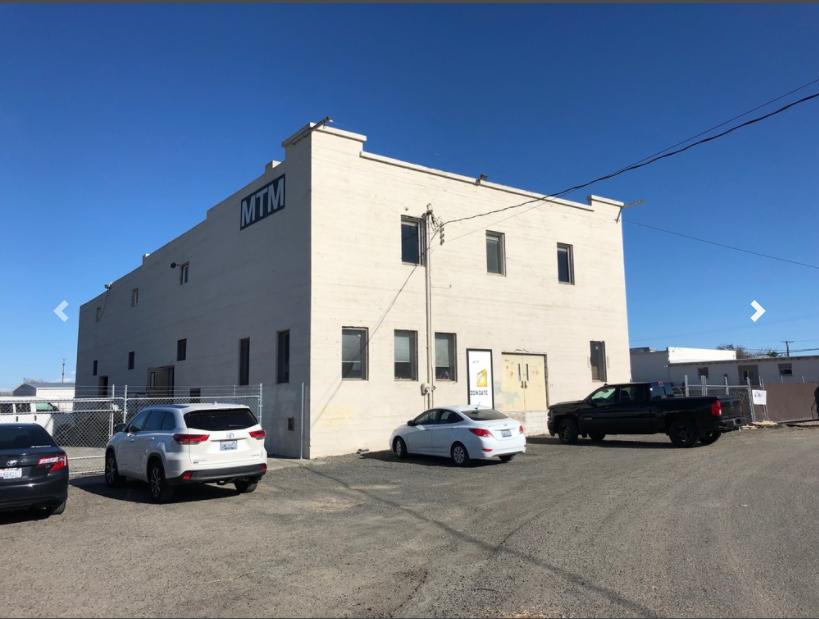
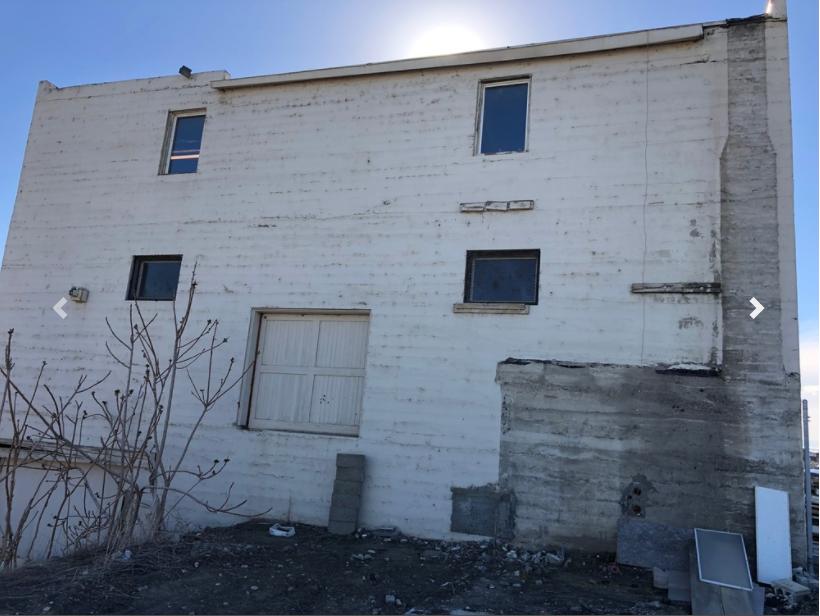
1-Mile | 3-Miles | 5-Miles | ||
---|---|---|---|---|
Total Population | 7,255 | 76,273 | 129,042 | |
Population Median Age | 36 | 34 | 34 | |
Population by Age | 0-9 Yrs | 1027 (14%) | 13901 (18%) | 22917 (17%) |
10-19 Yrs | 1121 (15%) | 12060 (15%) | 19596 (15%) | |
20-29 Yrs | 1062 (14%) | 10914 (14%) | 18419 (14%) | |
30-39 Yrs | 1067 (14%) | 10788 (14%) | 18229 (14%) | |
40-49 Yrs | 825 (11%) | 7956 (10%) | 13556 (10%) | |
50-59 Yrs | 854 (11%) | 8494 (11%) | 14547 (11%) | |
60-69 Yrs | 758 (10%) | 6503 (8%) | 11714 (9%) | |
70+ Yrs | 541 (7%) | 5656 (7%) | 10064 (7%) | |
Median HH Income | $36,634 | $48,542 | $57,070 | |
Total Household Income | < 24K | 834 (33%) | 6089 (25%) | 8612 (20%) |
25-49K | 751 (29%) | 6400 (26%) | 9777 (23%) | |
50-74K | 392 (15%) | 5041 (20%) | 8991 (21%) | |
75-99K | 291 (11%) | 2889 (11%) | 5724 (13%) | |
100-199K | 183 (7%) | 3305 (13%) | 7942 (18%) | |
200K+ | 63 (2%) | 582 (2%) | 1438 (3%) | |
Highest Education Level | No Diploma | 1285 | 12451 | 16238 |
Diploma or GED | 1491 | 12628 | 21432 | |
Some College | 1053 | 9646 | 17812 | |
Assoc. Degree | 303 | 3488 | 7057 | |
Bachelors Degree | 415 | 4339 | 9571 | |
Higher Degree | 158 | 2106 | 5150 | |
Total Housing Units | 2,747 | 25,828 | 44,837 | |
--Owner-Occupied | 1,310 | 14,280 | 27,749 | |
--Renter-Occupied | 1,203 | 10,027 | 14,736 | |
Owner-Occupied Values | < 100K | 386 | 2564 | 3687 |
100-199K | 740 | 6912 | 11105 | |
200-299K | 143 | 3440 | 8145 | |
300-399K | 20 | 907 | 3185 | |
400-499K | 4 | 136 | 718 | |
500K+ | 17 | 321 | 909 | |
Total Working Age Population | 5,426 | 54,972 | 94,279 | |
In Work Force | 3,186 | 34,205 | 59,958 | |
Not In Work Force | 2,240 | 20,767 | 34,321 | |
Workforce Employed | 2,985 | 31,671 | 55,756 | |
Workforce Unemployed | 201 | 2,515 | 4,079 | |
Civlian Workforce | 3,186 | 34,186 | 59,835 | |
Military Workforce | 0 | 19 | 123 | |
Total Households | 2,513 | 24,307 | 42,485 | |
Family Households | 1,440 | 16,783 | 29,666 | |
Non-Family Households | 1,073 | 7,525 | 12,819 | |
Married Couple | 889 | 10,758 | 20,452 | |
Other Family | 552 | 6,025 | 9,214 | |
Married w/Child | 465 | 5,057 | 9,662 | |
Single Male w/Child | 52 | 952 | 1,427 | |
Single Female w/Child | 248 | 2,833 | 4,554 |
Population Change Last Two Decades - Plus Projection
2000 | % | 2010 | % | 2020 | % | 2030 | |
---|---|---|---|---|---|---|---|
Washington | 5,894,121 | +14 | 6,724,540 | +14 | 7,638,415 | +11 | 8,503,178 |
Benton County | 142,475 | +23 | 175,177 | +15 | 201,563 | +13 | 228,162 |
Franklin County | 49,347 | +58 | 78,163 | +28 | 99,712 | +28 | 127,443 |
Walla Walla County | 55,180 | +7 | 58,781 | +6 | 62,049 | +5 | 65,052 |
Total Working Age Population:
Total Households:
Total Working Age Population:
Total Households:
Total Working Age Population:
Total Households: