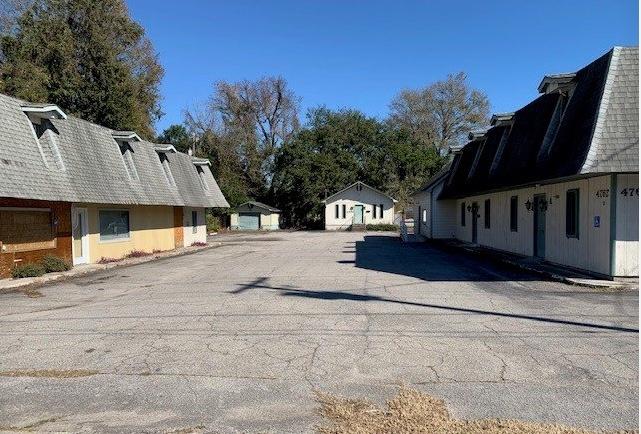
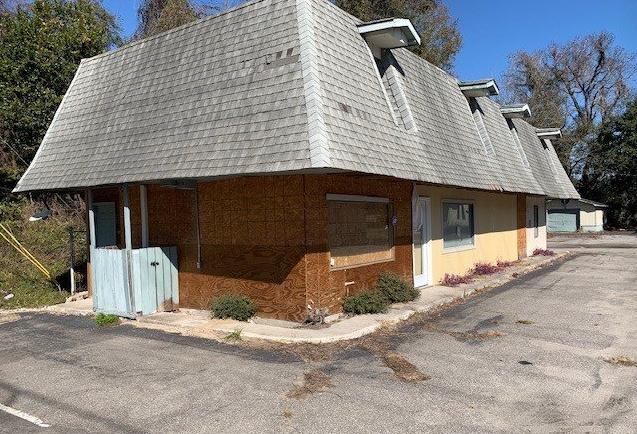
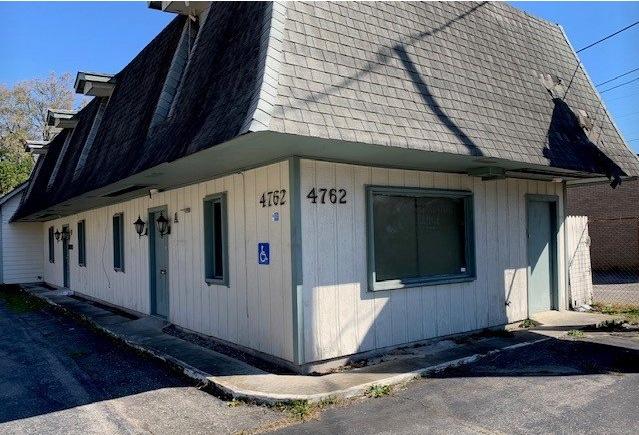
4762 AND 4766 RIVERS AVENUE NORTH CHARLESTON, SC 29405
B-2, General business district:
It is the intent of this section that the B-2 zoning district be established in the appropriate land reserved for general business purposes with particular consideration for general commercial development. The regulations that apply within this district are designed to encourage the formation and continuance of a compatible and economically healthy environment for business, financial, and professional service uses which benefit from being in close proximity to each other:
Permitted uses: The following uses shall be permitted in the B-2 zoning district:
All uses permitted in the R-1, OD and B-1 zoning districts;
All uses permitted in the R-2 zoning district shall also be permitted in all B-2 zoned areas except for B-2 locations within the Dorchester Road Corridor I (Upper Dorchester), Dorchester Corridor II (Middle Corridor), the University Boulevard and the Ladson Road overlay districts;
Corridor II (Middle Corridor), the University Boulevard and the Ladson Road overlay districts;
Temporary or transient lodging such as: hotels, motels, inns, hostels, missions, homeless shelters, or other shelters (provided, however, that missions, homeless shelters or other like facilities shall not be permitted in an area determined by city council, pursuant to ordinance and state law including the South Carolina Community Development Law and the South Carolina Tax Increment Finance Law, to be a blighted or conservation area);
LOWCOUNTRY RAPID TRANSIT CORRIDOR. Lowcountry Rapid Transit is a bus rapid transit system that connects, downtown Charleston, North Charleston and Summerville. More than just a transit system, this project will transform the infrastructure in our region to improve mobility for people on public transportation, in cars, on foot and on bikes, and will be a catalyst for economic growth and prosperity throughout the area. PROPOSED COMPLETION 2026.