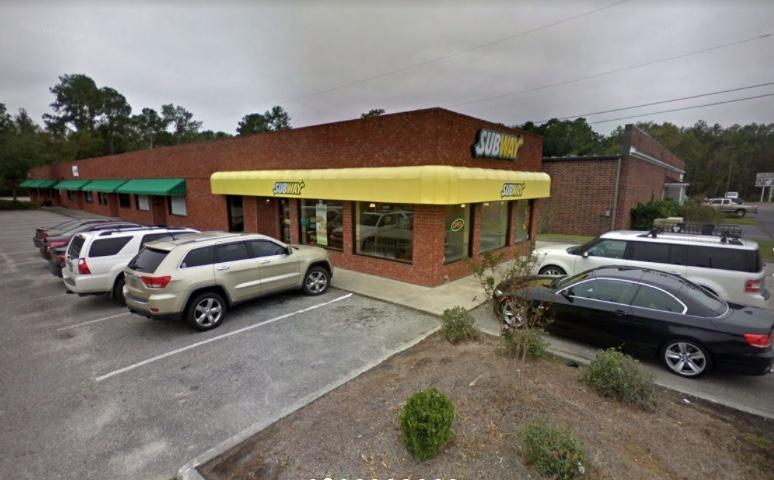
Retail Space
10125 Dorchester Road Summerville, SC 29485
10125 Dorchester Road Summerville, SC 29485
Details & Description
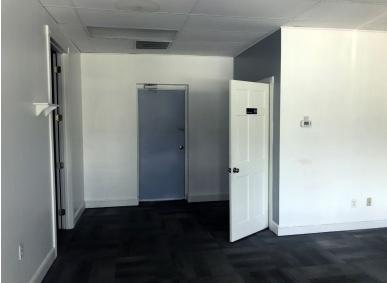
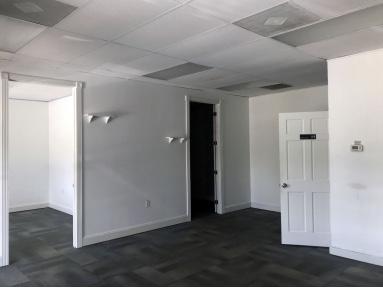
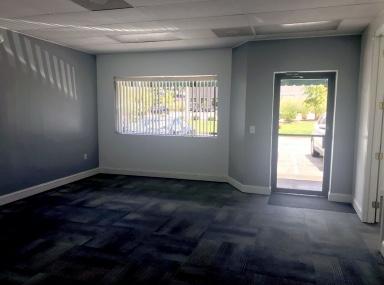
Additional Photos
Listing Agents

Brent Case
O: 843-744-9877
M: 843-270-4192
bcase@cbcatlantic.com
O: 843-744-9877
M: 843-270-4192
bcase@cbcatlantic.com
While we strive to provide the most accurate information, all listing information, and demographic data, is provided by third-parties. As such, MyEListing will not be responsible for the accuracy of the information. It is strongly recommended that you verify all information with the listing agent, and any relevant agencies, prior to making any decisions.


