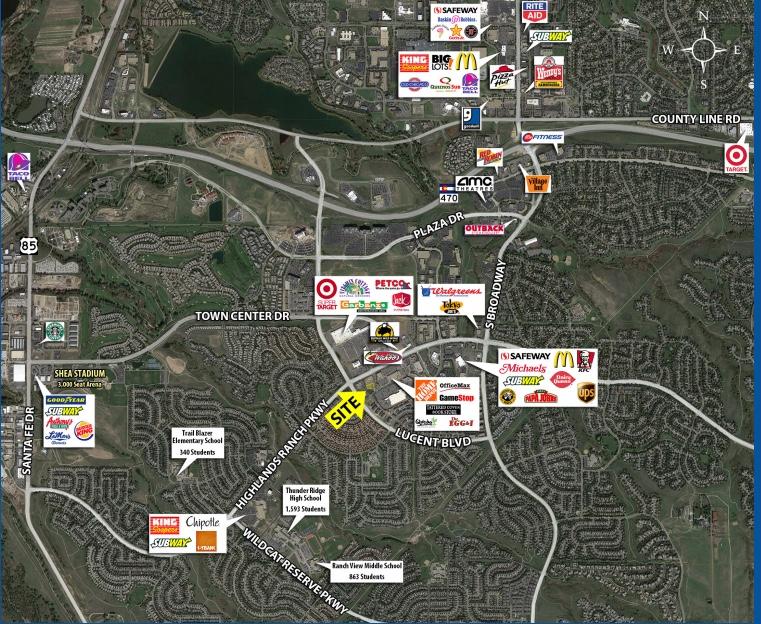
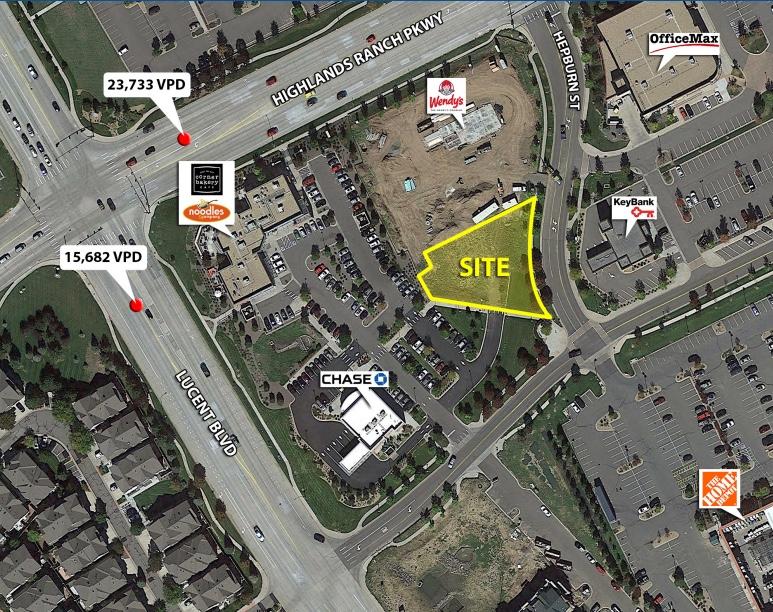
1-Mile | 3-Miles | 5-Miles | ||
---|---|---|---|---|
Total Population | 15,227 | 76,565 | 197,140 | |
Population Median Age | 37 | 40 | 40 | |
Population by Age | 0-9 Yrs | 1775 (11%) | 8532 (11%) | 22438 (11%) |
10-19 Yrs | 2221 (14%) | 11303 (14%) | 28813 (14%) | |
20-29 Yrs | 1670 (10%) | 6925 (9%) | 19061 (9%) | |
30-39 Yrs | 2070 (13%) | 8955 (11%) | 24521 (12%) | |
40-49 Yrs | 2927 (19%) | 12159 (15%) | 30201 (15%) | |
50-59 Yrs | 2283 (14%) | 12318 (16%) | 29071 (14%) | |
60-69 Yrs | 1391 (9%) | 8999 (11%) | 23544 (11%) | |
70+ Yrs | 891 (5%) | 7372 (9%) | 19490 (9%) | |
Median HH Income | $115,651 | $116,094 | $108,325 | |
Total Household Income | < 24K | 226 (3%) | 1629 (5%) | 5734 (7%) |
25-49K | 585 (9%) | 3017 (10%) | 8843 (11%) | |
50-74K | 765 (12%) | 3754 (12%) | 9905 (13%) | |
75-99K | 824 (13%) | 3613 (12%) | 9791 (13%) | |
100-199K | 2564 (43%) | 11827 (40%) | 27992 (37%) | |
200K+ | 957 (16%) | 5504 (18%) | 12542 (16%) | |
Highest Education Level | No Diploma | 91 | 777 | 3261 |
Diploma or GED | 1159 | 5825 | 17685 | |
Some College | 1694 | 9081 | 25677 | |
Assoc. Degree | 877 | 3974 | 10615 | |
Bachelors Degree | 4141 | 20864 | 50337 | |
Higher Degree | 2488 | 12712 | 29174 | |
Total Housing Units | 6,054 | 29,853 | 76,655 | |
--Owner-Occupied | 4,401 | 23,721 | 58,828 | |
--Renter-Occupied | 1,520 | 5,623 | 15,980 | |
Owner-Occupied Values | < 100K | 29 | 570 | 1012 |
100-199K | 23 | 393 | 1571 | |
200-299K | 250 | 1818 | 5843 | |
300-399K | 1273 | 5021 | 13294 | |
400-499K | 1804 | 7408 | 17390 | |
500K+ | 1022 | 8511 | 19718 | |
Total Working Age Population | 12,125 | 60,794 | 156,184 | |
In Work Force | 9,321 | 42,932 | 110,536 | |
Not In Work Force | 2,805 | 17,863 | 45,648 | |
Workforce Employed | 9,131 | 41,579 | 107,055 | |
Workforce Unemployed | 189 | 1,329 | 3,395 | |
Civlian Workforce | 9,321 | 42,908 | 110,450 | |
Military Workforce | 0 | 24 | 85 | |
Total Households | 5,921 | 29,344 | 74,808 | |
Family Households | 4,467 | 22,071 | 54,826 | |
Non-Family Households | 1,454 | 7,273 | 19,982 | |
Married Couple | 3,816 | 18,963 | 45,825 | |
Other Family | 651 | 3,108 | 9,001 | |
Married w/Child | 1,863 | 8,374 | 20,377 | |
Single Male w/Child | 118 | 616 | 1,663 | |
Single Female w/Child | 210 | 1,037 | 3,025 |
Population Change Last Two Decades - Plus Projection
2000 | % | 2010 | % | 2020 | % | 2030 | |
---|---|---|---|---|---|---|---|
Colorado | 4,301,261 | +17 | 5,029,196 | +16 | 5,838,181 | +15 | 6,733,658 |
Arapahoe County | 487,967 | +17 | 572,003 | +16 | 662,304 | +13 | 750,773 |
Denver County | 554,636 | +8 | 600,158 | +23 | 738,611 | +12 | 827,681 |
Douglas County | 175,766 | +62 | 285,465 | +23 | 350,161 | +16 | 405,087 |
Jefferson County | 527,056 | +1 | 534,543 | +10 | 587,118 | +7 | 626,742 |
Total Working Age Population:
Total Households:
Total Working Age Population:
Total Households:
Total Working Age Population:
Total Households: