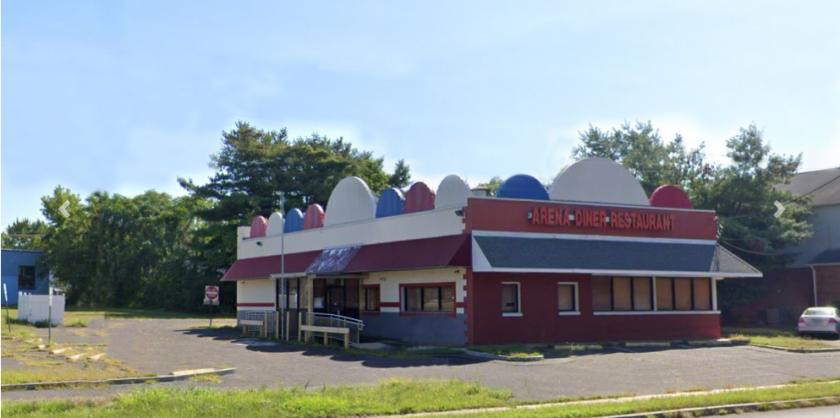
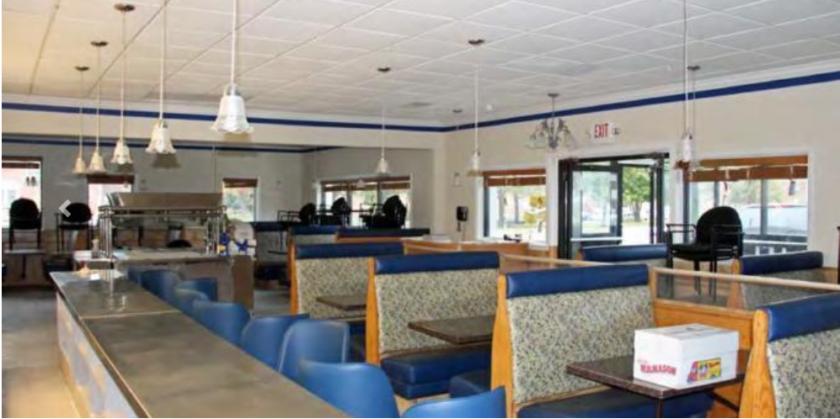
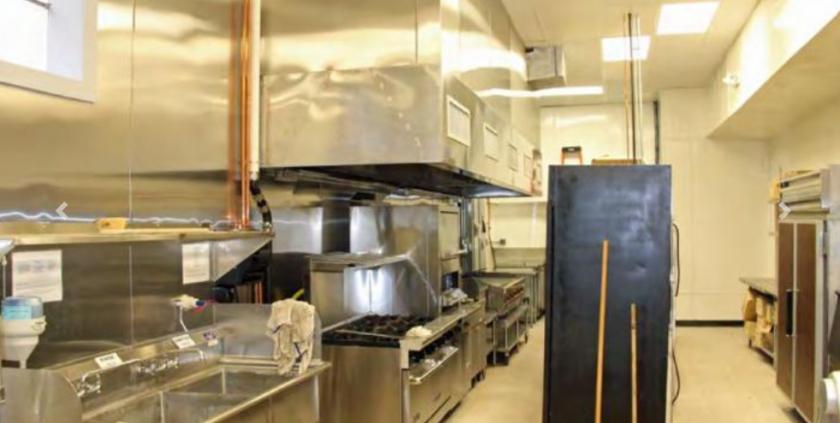
Exceptional opportunity to acquire a single story property on over an acre of land. A former diner and restaurant building with a full commercial kitchen. Recently renovated and modernized. Newly constructed entry foyer. The current allocation allows for two dining rooms with seating for approximately 100 plus additional 10 seats at a counter area, a newly improved kitchen, and two three-fixture lavatories. Existing drive-up window, great visibility, good signage, and easy access Ample parking, with expansion possibilities and additional parking lot.
Highlights
Prime retail /redevelopment opportunity
1.07 AC
3,475 RSF
Free-standing building
Existing drive-up window
Newly constructed entry foyer
Two dining rooms with seating for approximately 100 plus additional 10 seats at a counter area
Two three-fixture lavatories
Preparation area with two walk-in coolers/freezers
Ample parking
Expansion possibilities, and/or additional parking lot
Located less than 1/10th mile to I-295
Surrounded by high density residential development
No part of this information may be copied, reproduced, repurposed, or screen-captured for any commercial purpose without prior written authorization from MyEListing.
While we strive to provide the most accurate information, all listing information, and demographic data, is provided by third-parties. As such, MyEListing will not be responsible for the accuracy of the information. It is strongly recommended that you verify all information with the listing agent, and any relevant agencies, prior to making any decisions.
What is the asking price for 628 Arena Drive in Trenton?
The asking price for 628 Arena Drive is $495,000
What is the building size of this Retail property in Trenton, NJ?
The size of the building/unit at 628 Arena Drive in Trenton is 3,475 square feet
How much land does the Trenton, NJ property at 628 Arena Drive include?
628 Arena Drive in Trenton includes 1.070 acres of land
What kind of Retail is the propery at 628 Arena Drive?
The property at 628 Arena Drive Trenton, NJ 08610 is listed as a Free Standing Building Retail property
What is the population within 1 mile of 628 Arena Drive in Trenton?
The population within 1 mile of 628 Arena Drive Trenton, NJ 08610 is 14,536 people.
Who do I contact for questions about 628 Arena Drive?
You should contact the listing agent,
Chichi Ahia, for any details regarding this commercial listing.