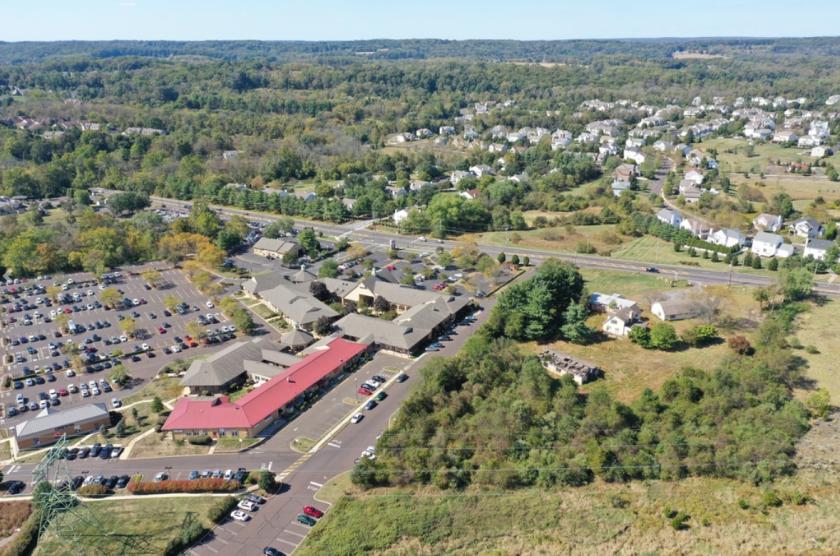
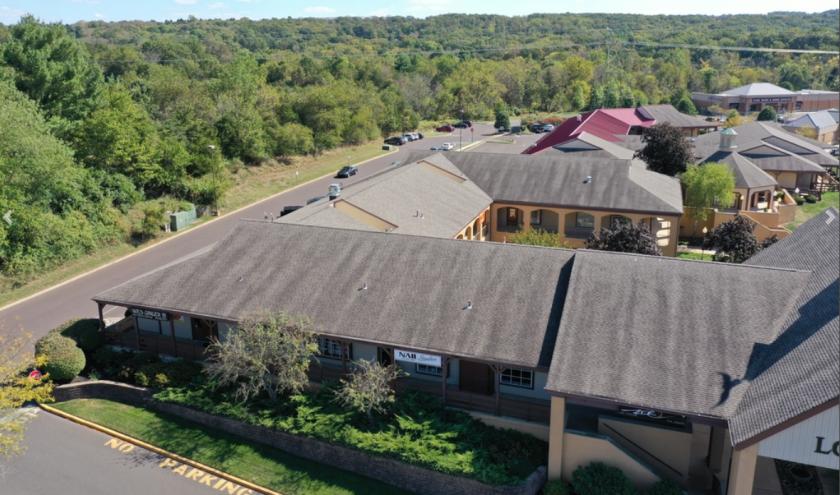
Exceptional and rare multi-unit office investment opportunity located in the highly desirable Logan Square complex in New Hope, Pennsylvania. The offering consists of four (4) income producing units. Total gross rentable area is 4,667 square feet occupied by quality tenants with good rental history. Excellent location in a well recognized condominium community hosting distinctive shops and offices. Conveniently located in a dense retail trade area. Amenities rich location with strong demographic profile.
Highlights
Office investment opportunity
Multi-unit office portfolio
Condo-fee simple
Maintenance free exterior
Located in Logan Square, New Hope
Dominant retail and office complex
100% occupancy
4,667 SF gross leasable area
Quality tenant mix of primarily medical tenants
Located in New Hope, Bucks County
$153,408 average household income within 5-mile radius
Amenities rich location
Close proximity to Lambertville, Doylestown and Peddler's Village
Convenient to Route 202, Route 413 and Route 27
No part of this information may be copied, reproduced, repurposed, or screen-captured for any commercial purpose without prior written authorization from MyEListing.
While we strive to provide the most accurate information, all listing information, and demographic data, is provided by third-parties. As such, MyEListing will not be responsible for the accuracy of the information. It is strongly recommended that you verify all information with the listing agent, and any relevant agencies, prior to making any decisions.
What is the asking price for 6542 Lower York Road in New Hope?
The asking price for 6542 Lower York Road is $1,300,000
What is the building size of this Office property in New Hope, PA?
The size of the building/unit at 6542 Lower York Road in New Hope is 4,667 square feet
How much land does the New Hope, PA property at 6542 Lower York Road include?
6542 Lower York Road in New Hope includes 6.800 acres of land
What kind of Office is the propery at 6542 Lower York Road?
The property at 6542 Lower York Road New Hope, PA 18938 is listed as a Professional Office property
What is the population within 1 mile of 6542 Lower York Road in New Hope?
The population within 1 mile of 6542 Lower York Road New Hope, PA 18938 is 2,207 people.
Who do I contact for questions about 6542 Lower York Road?
You should contact the listing agent,
Chichi Ahia, for any details regarding this commercial listing.