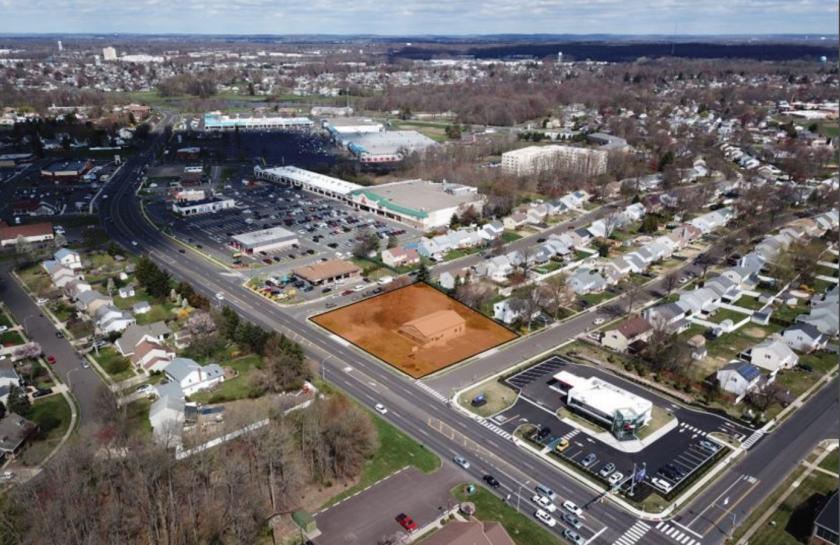
Grow your business at this prime Lower Bucks County Location. This level .82ac lot is well located among densely populated retail, office and residential areas. Zoned commercial, this corner lot has easy access from three sides, giving high visibly and ease of access. Current building is handicapped accessible and has ample parking.
Highlights
Two contiguous parcels totaling .82 acres
Highly visible and accessible location
18,000+ average daily traffic counts
Level Topography
Densely populated commercial and residential trade area
Minutes to/from US-1, US-1 Business, I-95/295, Rt. 13 and PA Turnpike
Commercially zoned, allowing for a multitude of uses by right
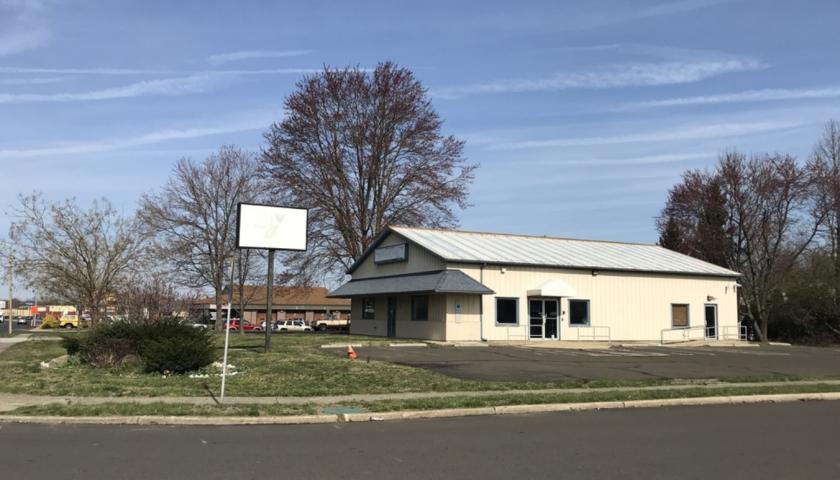
2,730 SF free-standing building with open concept floor plan
Handicapped accessible
Ample parking
Easy access with ingress/egress from each street
Back-lit double sided pylon
Significant new development in immediate area
Strong demographic profile
No part of this information may be copied, reproduced, repurposed, or screen-captured for any commercial purpose without prior written authorization from MyEListing.
While we strive to provide the most accurate information, all listing information, and demographic data, is provided by third-parties. As such, MyEListing will not be responsible for the accuracy of the information. It is strongly recommended that you verify all information with the listing agent, and any relevant agencies, prior to making any decisions.
What is the asking price for 555 South Oxford Valley Road in Fairless Hills?
The asking price for 555 South Oxford Valley Road is $1,000,000
What is the building size of this Retail property in Fairless Hills, PA?
The size of the building/unit at 555 South Oxford Valley Road in Fairless Hills is 2,500 square feet
How much land does the Fairless Hills, PA property at 555 South Oxford Valley Road include?
555 South Oxford Valley Road in Fairless Hills includes 0.820 acres of land
What kind of Retail is the propery at 555 South Oxford Valley Road?
The property at 555 South Oxford Valley Road Fairless Hills, PA 19030 is listed as a Other Retail Retail property
What is the population within 1 mile of 555 South Oxford Valley Road in Fairless Hills?
The population within 1 mile of 555 South Oxford Valley Road Fairless Hills, PA 19030 is 14,018 people.
Who do I contact for questions about 555 South Oxford Valley Road?
You should contact the listing agent,
Charles Calvet, for any details regarding this commercial listing.