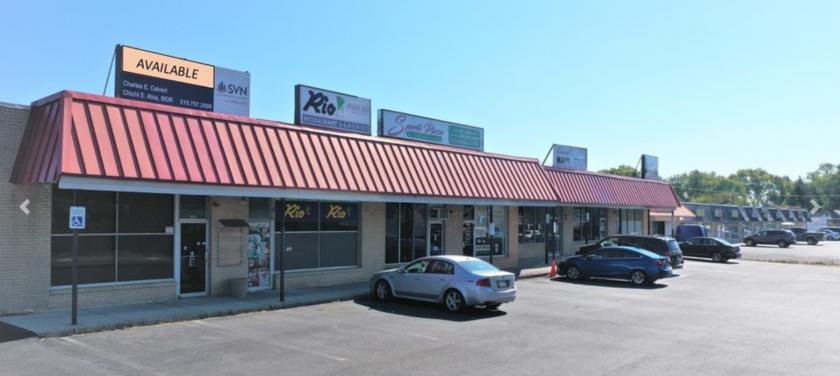
An exceptional opportunity to acquire a multi-unit retail investment property in lower Bucks County, Pennsylvania. This seven unit strip mall serves a busy neighborhood community in a densely populated area of Levittown. Key tenants include a long-term childcare center which recently expanded to 3 units and an Italian restaurant occupying 2 units. Currently 2 contiguous units are available for lease, including the highly visible end unit. Great opportunity for a long-term investment or an owner operator maximizing their business operation.
Highlights
Five of seven units leased to 2 long-term tenants
Two contiguous units currently available
Well-built block and brick front construction
Excellent rooftop signage
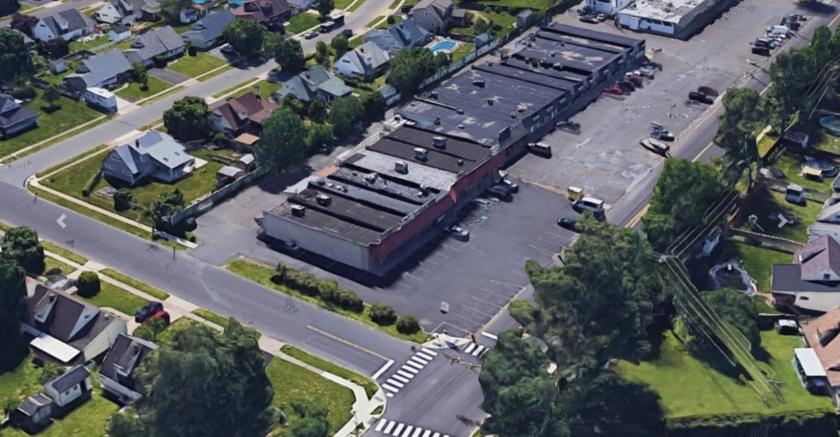
Ample parking - 30+ spaces
Shopping Center Pylon and Restaurant Pylon
Rear delivery alley
Signalized intersection
Highly visible/accessible location
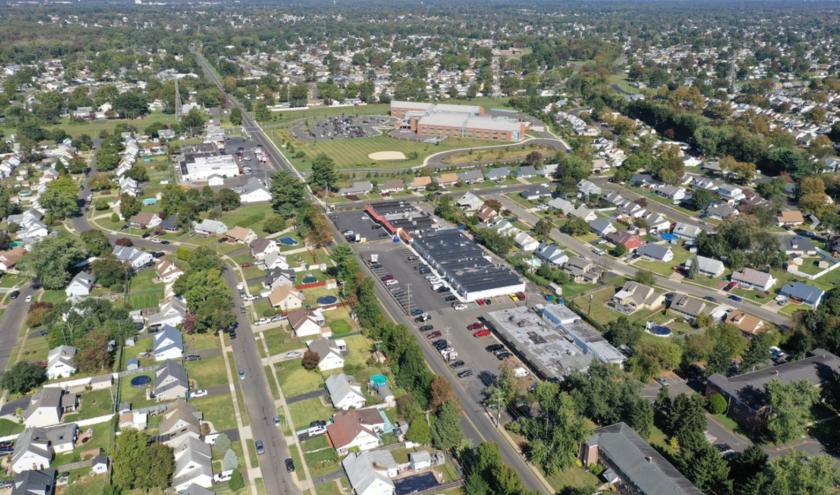
Situated on busy neighborhood commuter route
Densely populated neighborhood area near active commercial and industrial markets
Convenient access to Route 13, Route 1, Interstate 295, PA turnpike and New Jersey
No part of this information may be copied, reproduced, repurposed, or screen-captured for any commercial purpose without prior written authorization from MyEListing.
While we strive to provide the most accurate information, all listing information, and demographic data, is provided by third-parties. As such, MyEListing will not be responsible for the accuracy of the information. It is strongly recommended that you verify all information with the listing agent, and any relevant agencies, prior to making any decisions.
What is the asking price for 1568 Haines Road in Levittown?
The asking price for 1568 Haines Road is $1,000,000
What is the building size of this Retail property in Levittown, PA?
The size of the building/unit at 1568 Haines Road in Levittown is 9,555 square feet
How much land does the Levittown, PA property at 1568 Haines Road include?
1568 Haines Road in Levittown includes 0.690 acres of land
What kind of Retail is the propery at 1568 Haines Road?
The property at 1568 Haines Road Levittown, PA 19055 is listed as a Other Retail Retail property
What is the population within 1 mile of 1568 Haines Road in Levittown?
The population within 1 mile of 1568 Haines Road Levittown, PA 19055 is 10,153 people.
Who do I contact for questions about 1568 Haines Road?
You should contact the listing agent,
Charles Calvet, for any details regarding this commercial listing.