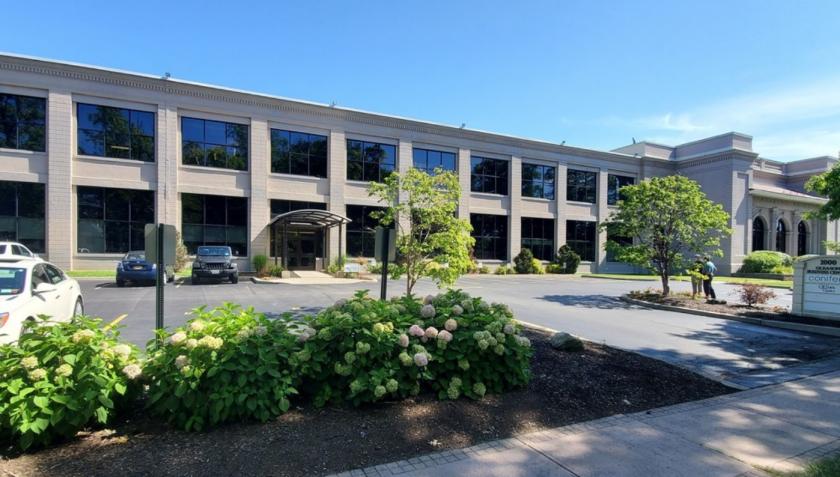
Office Space
57 Davison Ct Lockport, NY 14094
57 Davison Ct Lockport, NY 14094
Details & Description
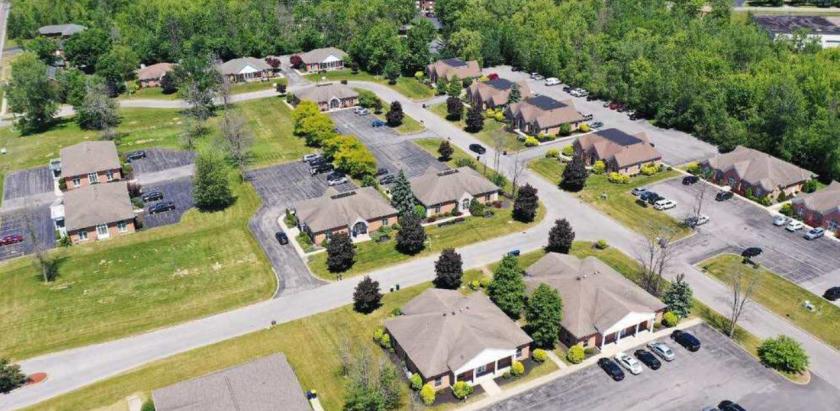
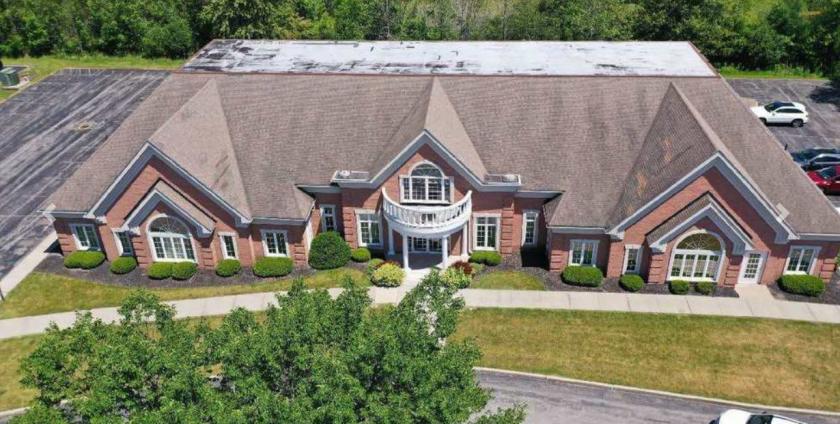
Additional Photos

Listing Agents

Robert Marvin
O: 585697090122
Robert.marvin@svn.com
O: 585697090122
Robert.marvin@svn.com
While we strive to provide the most accurate information, all listing information, and demographic data, is provided by third-parties. As such, MyEListing will not be responsible for the accuracy of the information. It is strongly recommended that you verify all information with the listing agent, and any relevant agencies, prior to making any decisions.


