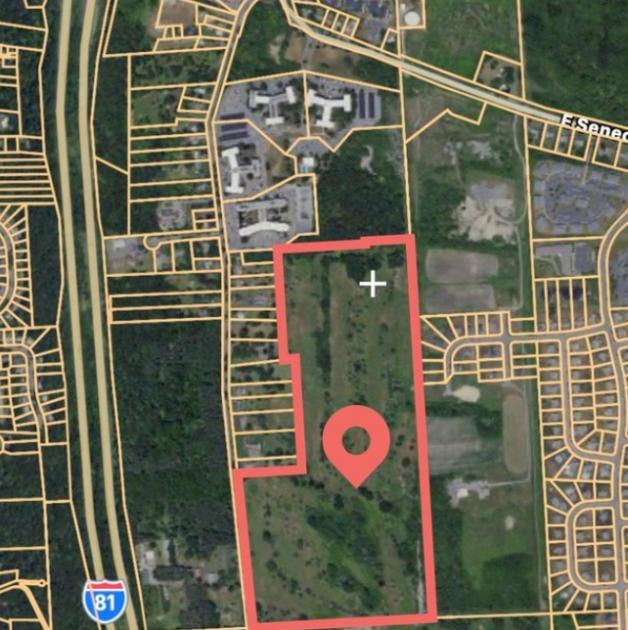
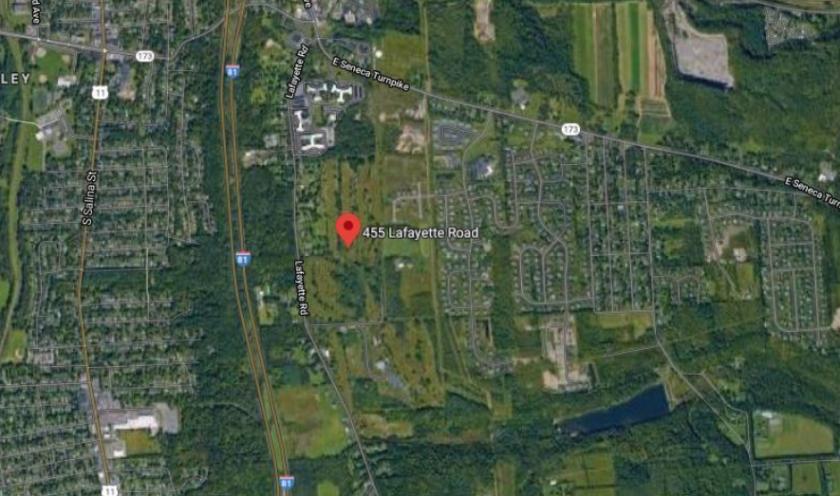
1-Mile | 3-Miles | 5-Miles | ||
---|---|---|---|---|
Total Population | 5,214 | 48,981 | 137,016 | |
Population Median Age | 42 | 37 | 36 | |
Population by Age | 0-9 Yrs | 564 (10%) | 5553 (11%) | 16036 (11%) |
10-19 Yrs | 516 (9%) | 8480 (17%) | 23570 (17%) | |
20-29 Yrs | 837 (16%) | 8863 (18%) | 25527 (18%) | |
30-39 Yrs | 660 (12%) | 5384 (10%) | 16407 (11%) | |
40-49 Yrs | 483 (9%) | 4625 (9%) | 12872 (9%) | |
50-59 Yrs | 603 (11%) | 5832 (11%) | 16196 (11%) | |
60-69 Yrs | 746 (14%) | 5087 (10%) | 13528 (9%) | |
70+ Yrs | 807 (15%) | 5158 (10%) | 12882 (9%) | |
Median HH Income | $46,568 | $47,178 | $45,160 | |
Total Household Income | < 24K | 732 (31%) | 5374 (30%) | 16119 (31%) |
25-49K | 551 (23%) | 3986 (22%) | 11510 (22%) | |
50-74K | 314 (13%) | 2660 (15%) | 7591 (14%) | |
75-99K | 171 (7%) | 1868 (10%) | 4882 (9%) | |
100-199K | 527 (22%) | 2762 (15%) | 8298 (16%) | |
200K+ | 50 (2%) | 919 (5%) | 2359 (4%) | |
Highest Education Level | No Diploma | 348 | 3668 | 11424 |
Diploma or GED | 1069 | 7959 | 20067 | |
Some College | 700 | 5124 | 14021 | |
Assoc. Degree | 378 | 2732 | 7323 | |
Bachelors Degree | 750 | 4915 | 15183 | |
Higher Degree | 575 | 5178 | 14567 | |
Total Housing Units | 2,747 | 21,002 | 61,355 | |
--Owner-Occupied | 1,232 | 9,415 | 23,515 | |
--Renter-Occupied | 1,113 | 8,153 | 27,245 | |
Owner-Occupied Values | < 100K | 488 | 4143 | 8573 |
100-199K | 524 | 2905 | 8932 | |
200-299K | 59 | 941 | 3060 | |
300-399K | 53 | 687 | 1496 | |
400-499K | 74 | 417 | 651 | |
500K+ | 34 | 322 | 803 | |
Total Working Age Population | 4,373 | 40,168 | 111,915 | |
In Work Force | 2,432 | 22,069 | 62,157 | |
Not In Work Force | 1,941 | 18,099 | 49,758 | |
Workforce Employed | 2,295 | 20,153 | 56,920 | |
Workforce Unemployed | 137 | 1,898 | 5,168 | |
Civlian Workforce | 2,432 | 22,052 | 62,087 | |
Military Workforce | 0 | 17 | 69 | |
Total Households | 2,345 | 17,568 | 50,760 | |
Family Households | 1,165 | 10,409 | 26,498 | |
Non-Family Households | 1,180 | 7,159 | 24,263 | |
Married Couple | 761 | 5,845 | 15,355 | |
Other Family | 404 | 4,564 | 11,143 | |
Married w/Child | 257 | 2,228 | 5,813 | |
Single Male w/Child | 42 | 532 | 1,075 | |
Single Female w/Child | 116 | 2,009 | 5,448 |
Population Change Last Two Decades - Plus Projection
2000 | % | 2010 | % | 2020 | % | 2030 | |
---|---|---|---|---|---|---|---|
New York | 18,976,457 | +2 | 19,378,102 | +4 | 20,146,131 | +2 | 20,604,030 |
Onondaga County | 458,336 | +2 | 467,026 | 0 | 467,461 | -1 | 463,795 |
Total Working Age Population:
Total Households:
Total Working Age Population:
Total Households:
Total Working Age Population:
Total Households: