Second (2nd) floor light filled office space
ADA compliant building with elevator
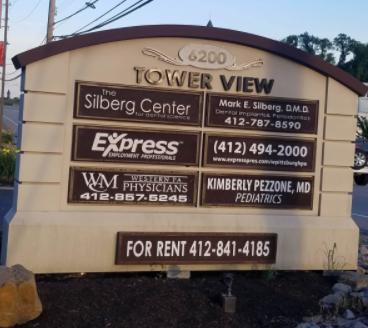
Mix of medical and non-medical tenants.
Combination of enclosed offices and open space
Two (2) internal restrooms, one with newly installed shower.
High end carpeting and freshly painted walls
Ample free parking spaces, lot recently resurfaced
Individually zoned elect and gas; water/sewer/trash incl
Tenant to pay Janitorial and utilities in addition to rent
Signage availability on monument sign.
No part of this information may be copied, reproduced, repurposed, or screen-captured for any commercial purpose without prior written authorization from MyEListing.
While we strive to provide the most accurate information, all listing information, and demographic data, is provided by third-parties. As such, MyEListing will not be responsible for the accuracy of the information. It is strongly recommended that you verify all information with the listing agent, and any relevant agencies, prior to making any decisions.
What is the asking price for 6200 Steubenville Pike in Pittsburgh?
The asking price for 6200 Steubenville Pike is $19.50 a SF per Year
What is the building size of this commercial Office property?
The size of this lease property at '.6200 Steubenville Pike.' is 1490 square feet
What kind of Office is the propery at 6200 Steubenville Pike?
The property at 6200 Steubenville Pike Pittsburgh, PA 15205 is listed as a Medical Office property
What is the population within 1 mile of 6200 Steubenville Pike in Pittsburgh?
The population within 1 mile of 6200 Steubenville Pike Pittsburgh, PA 15205 is 2,093 people.
Who do I contact for questions about 6200 Steubenville Pike?
You should contact the listing agent,
Meagan Moore, for any details regarding this commercial listing.