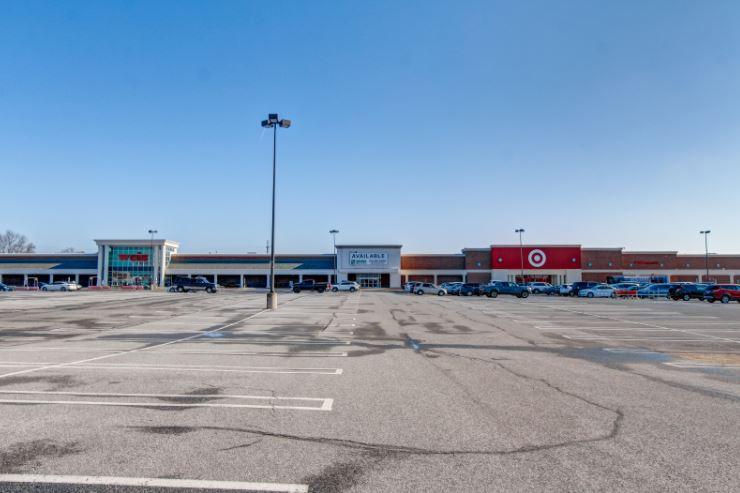
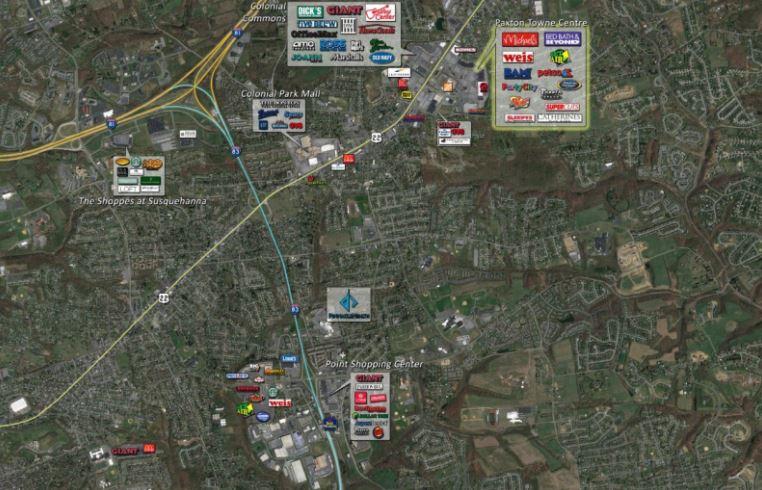
1-Mile | 3-Miles | 5-Miles | ||
---|---|---|---|---|
Total Population | 7,054 | 55,177 | 128,396 | |
Population Median Age | 39 | 40 | 39 | |
Population by Age | 0-9 Yrs | 740 (10%) | 6382 (11%) | 16300 (12%) |
10-19 Yrs | 873 (12%) | 6175 (11%) | 15825 (12%) | |
20-29 Yrs | 1203 (17%) | 7513 (13%) | 17133 (13%) | |
30-39 Yrs | 989 (14%) | 7328 (13%) | 16512 (12%) | |
40-49 Yrs | 745 (10%) | 6879 (12%) | 16037 (12%) | |
50-59 Yrs | 877 (12%) | 7521 (13%) | 17130 (13%) | |
60-69 Yrs | 840 (11%) | 7104 (12%) | 16568 (12%) | |
70+ Yrs | 787 (11%) | 6274 (11%) | 12893 (10%) | |
Median HH Income | $69,332 | $67,094 | $63,350 | |
Total Household Income | < 24K | 266 (9%) | 3338 (14%) | 8596 (16%) |
25-49K | 695 (24%) | 5246 (22%) | 11481 (22%) | |
50-74K | 542 (19%) | 4331 (18%) | 10300 (19%) | |
75-99K | 416 (14%) | 3426 (14%) | 7512 (14%) | |
100-199K | 756 (26%) | 5779 (24%) | 11544 (22%) | |
200K+ | 155 (5%) | 1271 (5%) | 2539 (4%) | |
Highest Education Level | No Diploma | 240 | 2590 | 7889 |
Diploma or GED | 1814 | 12479 | 28667 | |
Some College | 812 | 6521 | 15232 | |
Assoc. Degree | 451 | 3706 | 8300 | |
Bachelors Degree | 947 | 8865 | 17989 | |
Higher Degree | 556 | 4910 | 10334 | |
Total Housing Units | 2,967 | 24,626 | 56,479 | |
--Owner-Occupied | 2,045 | 15,152 | 32,753 | |
--Renter-Occupied | 784 | 8,238 | 19,219 | |
Owner-Occupied Values | < 100K | 81 | 789 | 4469 |
100-199K | 1325 | 8211 | 15768 | |
200-299K | 582 | 3912 | 7583 | |
300-399K | 20 | 1330 | 3116 | |
400-499K | 17 | 410 | 803 | |
500K+ | 21 | 500 | 1014 | |
Total Working Age Population | 5,706 | 45,094 | 101,996 | |
In Work Force | 3,848 | 30,511 | 67,761 | |
Not In Work Force | 1,858 | 14,583 | 34,234 | |
Workforce Employed | 3,720 | 29,136 | 64,127 | |
Workforce Unemployed | 115 | 1,301 | 3,493 | |
Civlian Workforce | 3,835 | 30,437 | 67,619 | |
Military Workforce | 13 | 74 | 142 | |
Total Households | 2,829 | 23,390 | 51,972 | |
Family Households | 1,837 | 14,353 | 32,894 | |
Non-Family Households | 992 | 9,037 | 19,078 | |
Married Couple | 1,429 | 10,675 | 22,447 | |
Other Family | 408 | 3,678 | 10,447 | |
Married w/Child | 580 | 4,110 | 8,188 | |
Single Male w/Child | 15 | 482 | 1,354 | |
Single Female w/Child | 136 | 1,267 | 4,203 |
Population Change Last Two Decades - Plus Projection
2000 | % | 2010 | % | 2020 | % | 2030 | |
---|---|---|---|---|---|---|---|
Pennsylvania | 12,281,054 | +3 | 12,702,379 | +4 | 13,230,170 | +4 | 13,759,594 |
Cumberland County | 213,674 | +10 | 235,406 | +7 | 251,836 | +6 | 268,063 |
Dauphin County | 251,798 | +6 | 268,100 | +4 | 279,506 | +3 | 289,132 |
Lancaster County | 470,658 | +10 | 519,445 | +8 | 559,247 | +8 | 602,153 |
Total Working Age Population:
Total Households:
Total Working Age Population:
Total Households:
Total Working Age Population:
Total Households: