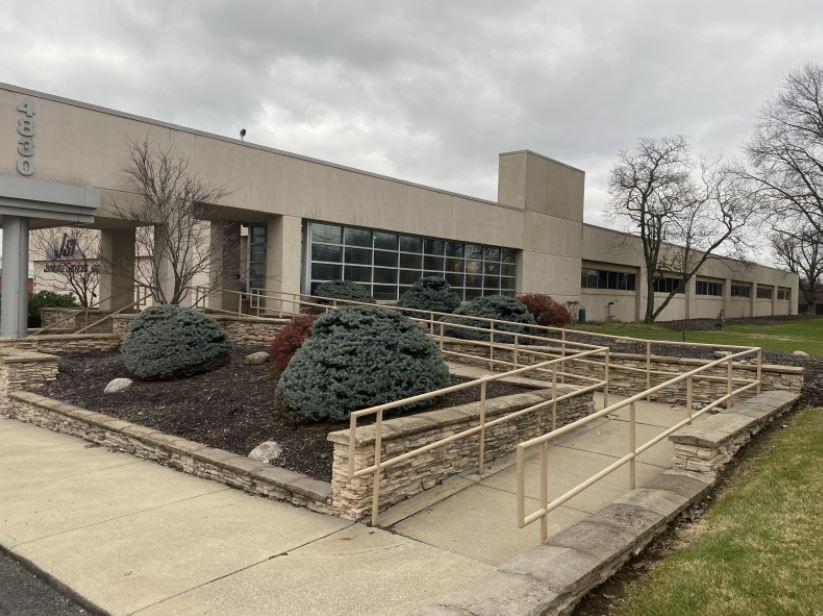
1-Mile | 3-Miles | 5-Miles | ||
---|---|---|---|---|
Total Population | 1,598 | 81,888 | 280,346 | |
Population Median Age | 42 | 39 | 39 | |
Population by Age | 0-9 Yrs | 204 (12%) | 9675 (11%) | 34213 (12%) |
10-19 Yrs | 186 (11%) | 10272 (12%) | 34870 (12%) | |
20-29 Yrs | 139 (8%) | 10874 (13%) | 39128 (13%) | |
30-39 Yrs | 186 (11%) | 11156 (13%) | 36944 (13%) | |
40-49 Yrs | 221 (13%) | 9368 (11%) | 33803 (12%) | |
50-59 Yrs | 205 (12%) | 12228 (14%) | 39527 (14%) | |
60-69 Yrs | 256 (16%) | 10061 (12%) | 33088 (11%) | |
70+ Yrs | 201 (12%) | 8254 (10%) | 28772 (10%) | |
Median HH Income | $67,524 | $37,819 | $38,919 | |
Total Household Income | < 24K | 100 (15%) | 11836 (33%) | 40882 (33%) |
25-49K | 131 (20%) | 10108 (28%) | 31836 (26%) | |
50-74K | 130 (20%) | 5707 (15%) | 20126 (16%) | |
75-99K | 104 (16%) | 3614 (10%) | 12234 (10%) | |
100-199K | 156 (24%) | 4011 (11%) | 13740 (11%) | |
200K+ | 28 (4%) | 456 (1%) | 1930 (1%) | |
Highest Education Level | No Diploma | 87 | 8769 | 29635 |
Diploma or GED | 412 | 20747 | 68773 | |
Some College | 245 | 13584 | 45696 | |
Assoc. Degree | 75 | 4144 | 15737 | |
Bachelors Degree | 219 | 6848 | 23200 | |
Higher Degree | 109 | 2917 | 11258 | |
Total Housing Units | 683 | 41,710 | 143,356 | |
--Owner-Occupied | 517 | 19,903 | 65,523 | |
--Renter-Occupied | 131 | 15,828 | 55,224 | |
Owner-Occupied Values | < 100K | 75 | 12603 | 40111 |
100-199K | 297 | 5854 | 19583 | |
200-299K | 124 | 992 | 3454 | |
300-399K | 19 | 244 | 1194 | |
400-499K | 2 | 118 | 503 | |
500K+ | 1 | 91 | 679 | |
Total Working Age Population | 1,261 | 66,565 | 225,207 | |
In Work Force | 833 | 41,352 | 139,633 | |
Not In Work Force | 428 | 25,213 | 85,574 | |
Workforce Employed | 804 | 37,159 | 124,550 | |
Workforce Unemployed | 29 | 4,178 | 15,011 | |
Civlian Workforce | 833 | 41,337 | 139,561 | |
Military Workforce | 0 | 15 | 72 | |
Total Households | 648 | 35,731 | 120,748 | |
Family Households | 422 | 19,090 | 66,505 | |
Non-Family Households | 226 | 16,641 | 54,243 | |
Married Couple | 308 | 10,391 | 34,230 | |
Other Family | 114 | 8,699 | 32,275 | |
Married w/Child | 113 | 3,471 | 11,183 | |
Single Male w/Child | 11 | 903 | 3,078 | |
Single Female w/Child | 43 | 3,998 | 14,351 |
Population Change Last Two Decades - Plus Projection
2000 | % | 2010 | % | 2020 | % | 2030 | |
---|---|---|---|---|---|---|---|
Ohio | 11,353,140 | +2 | 11,536,504 | 0 | 11,574,870 | 0 | 11,615,100 |
Cuyahoga County | 1,393,978 | -8 | 1,280,122 | -6 | 1,209,550 | -5 | 1,154,210 |
Total Working Age Population:
Total Households:
Total Working Age Population:
Total Households:
Total Working Age Population:
Total Households: