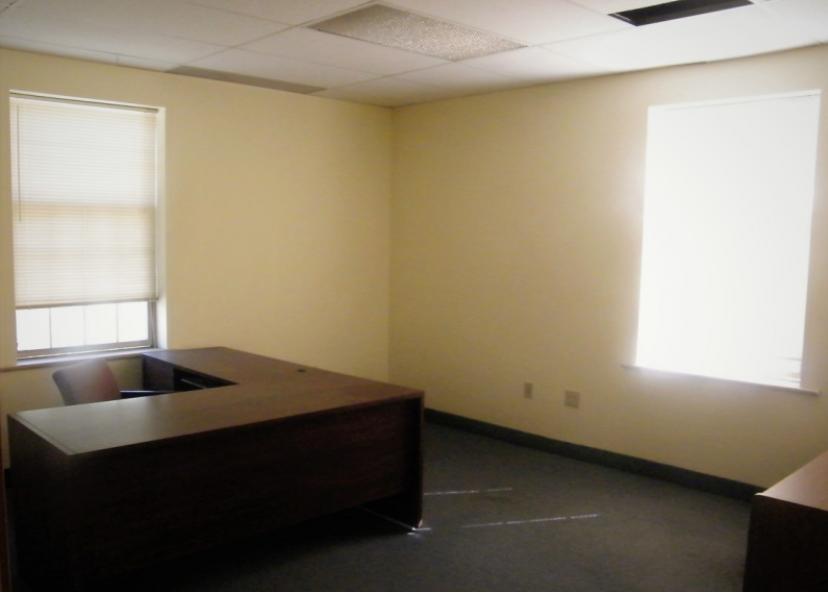
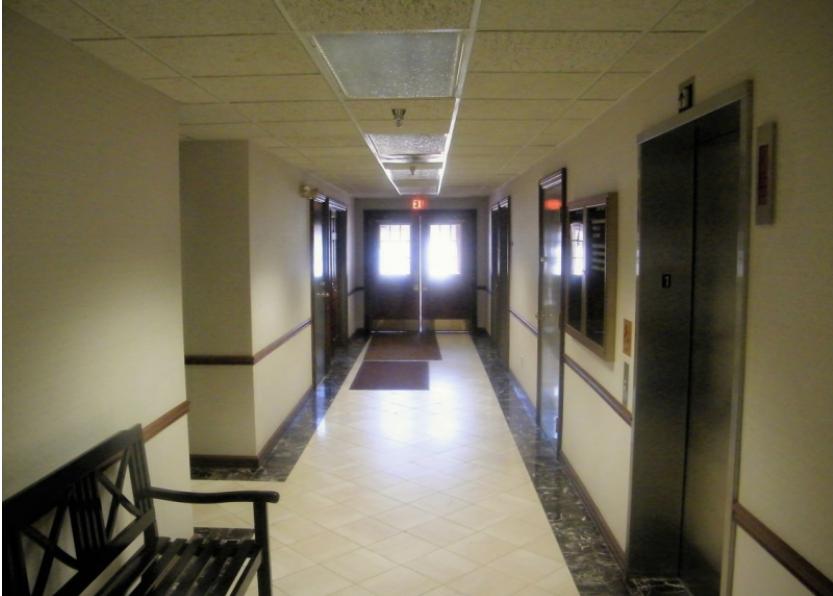
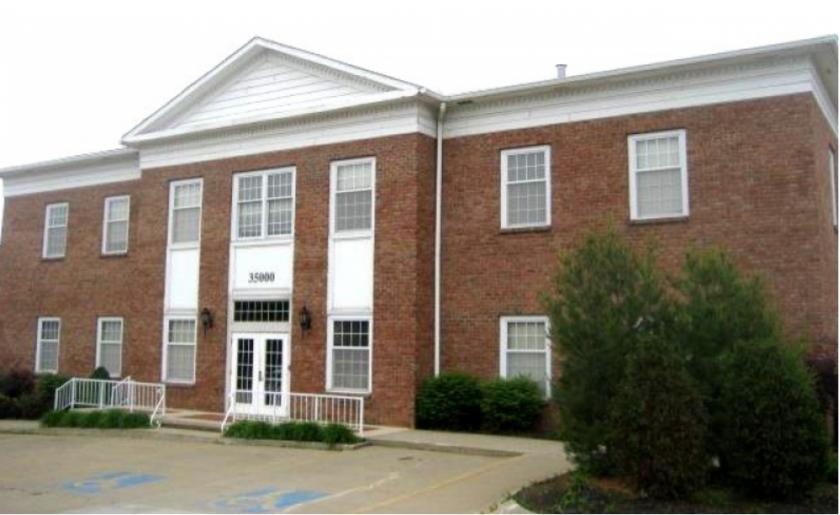
1-Mile | 3-Miles | 5-Miles | ||
---|---|---|---|---|
Total Population | 2,379 | 39,123 | 146,447 | |
Population Median Age | 44 | 43 | 42 | |
Population by Age | 0-9 Yrs | 150 (6%) | 3606 (9%) | 15583 (10%) |
10-19 Yrs | 284 (11%) | 4088 (10%) | 15473 (10%) | |
20-29 Yrs | 326 (13%) | 5509 (14%) | 19675 (13%) | |
30-39 Yrs | 229 (9%) | 4090 (10%) | 17519 (11%) | |
40-49 Yrs | 392 (16%) | 4443 (11%) | 16248 (11%) | |
50-59 Yrs | 368 (15%) | 5653 (14%) | 21480 (14%) | |
60-69 Yrs | 258 (10%) | 5489 (14%) | 19446 (13%) | |
70+ Yrs | 372 (15%) | 6244 (15%) | 21023 (14%) | |
Median HH Income | $69,519 | $58,071 | $52,440 | |
Total Household Income | < 24K | 123 (11%) | 3489 (19%) | 15554 (22%) |
25-49K | 157 (15%) | 4481 (24%) | 17083 (25%) | |
50-74K | 315 (30%) | 3561 (19%) | 12805 (18%) | |
75-99K | 144 (13%) | 2496 (13%) | 9110 (13%) | |
100-199K | 225 (21%) | 3268 (17%) | 10841 (15%) | |
200K+ | 81 (7%) | 966 (5%) | 2494 (3%) | |
Highest Education Level | No Diploma | 141 | 1952 | 7848 |
Diploma or GED | 454 | 8347 | 31482 | |
Some College | 271 | 6075 | 24819 | |
Assoc. Degree | 175 | 2567 | 9637 | |
Bachelors Degree | 462 | 5712 | 20070 | |
Higher Degree | 306 | 4240 | 12484 | |
Total Housing Units | 1,165 | 19,852 | 74,723 | |
--Owner-Occupied | 608 | 11,137 | 39,591 | |
--Renter-Occupied | 437 | 7,124 | 28,296 | |
Owner-Occupied Values | < 100K | 18 | 2058 | 10527 |
100-199K | 186 | 4857 | 18808 | |
200-299K | 142 | 1746 | 5523 | |
300-399K | 120 | 1296 | 2316 | |
400-499K | 81 | 659 | 1124 | |
500K+ | 61 | 521 | 1293 | |
Total Working Age Population | 2,064 | 33,125 | 122,018 | |
In Work Force | 1,273 | 20,837 | 78,540 | |
Not In Work Force | 791 | 12,288 | 43,478 | |
Workforce Employed | 1,234 | 19,981 | 73,981 | |
Workforce Unemployed | 39 | 848 | 4,523 | |
Civlian Workforce | 1,273 | 20,829 | 78,505 | |
Military Workforce | 0 | 8 | 35 | |
Total Households | 1,045 | 18,261 | 67,886 | |
Family Households | 716 | 10,361 | 37,574 | |
Non-Family Households | 328 | 7,900 | 30,313 | |
Married Couple | 586 | 7,526 | 25,538 | |
Other Family | 130 | 2,835 | 12,036 | |
Married w/Child | 177 | 2,275 | 8,538 | |
Single Male w/Child | 11 | 269 | 1,079 | |
Single Female w/Child | 45 | 1,103 | 4,762 |
Population Change Last Two Decades - Plus Projection
2000 | % | 2010 | % | 2020 | % | 2030 | |
---|---|---|---|---|---|---|---|
Ohio | 11,353,140 | +2 | 11,536,504 | 0 | 11,574,870 | 0 | 11,615,100 |
Cuyahoga County | 1,393,978 | -8 | 1,280,122 | -6 | 1,209,550 | -5 | 1,154,210 |
Geauga County | 90,895 | +3 | 93,389 | 0 | 93,510 | +2 | 94,930 |
Lake County | 227,511 | +1 | 230,041 | -1 | 228,600 | 0 | 228,380 |
Total Working Age Population:
Total Households:
Total Working Age Population:
Total Households:
Total Working Age Population:
Total Households: