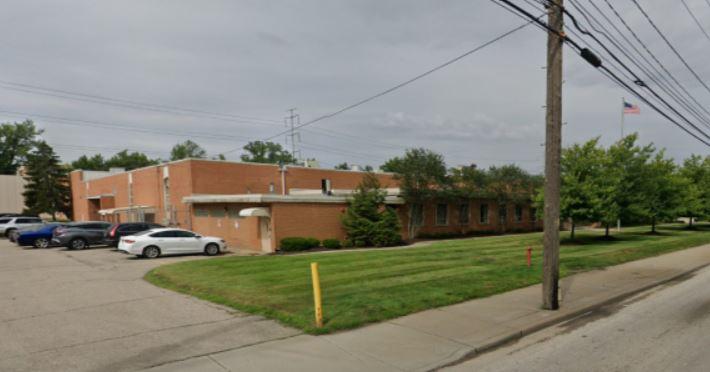
Industrial Properties
13700 Broadway Avenue Garfield Heights, OH 44125
13700 Broadway Avenue Garfield Heights, OH 44125
Details & Description
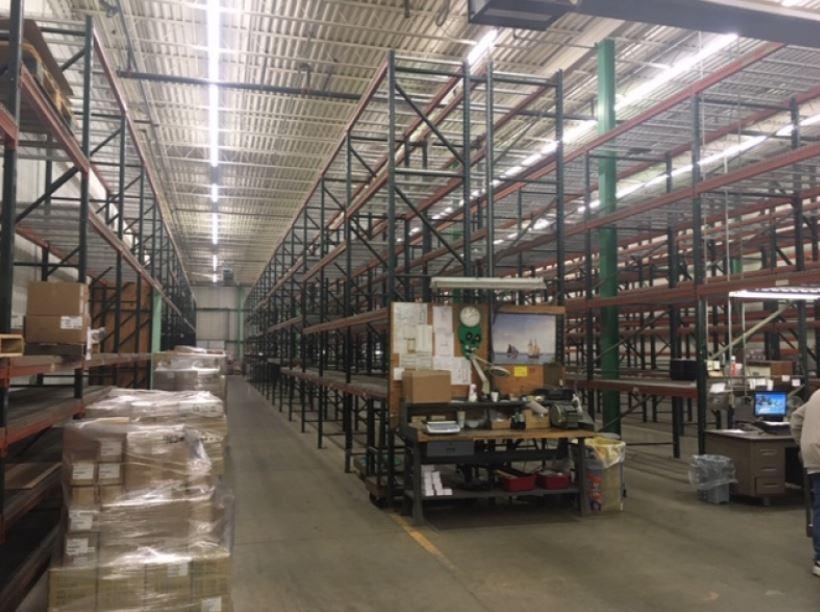
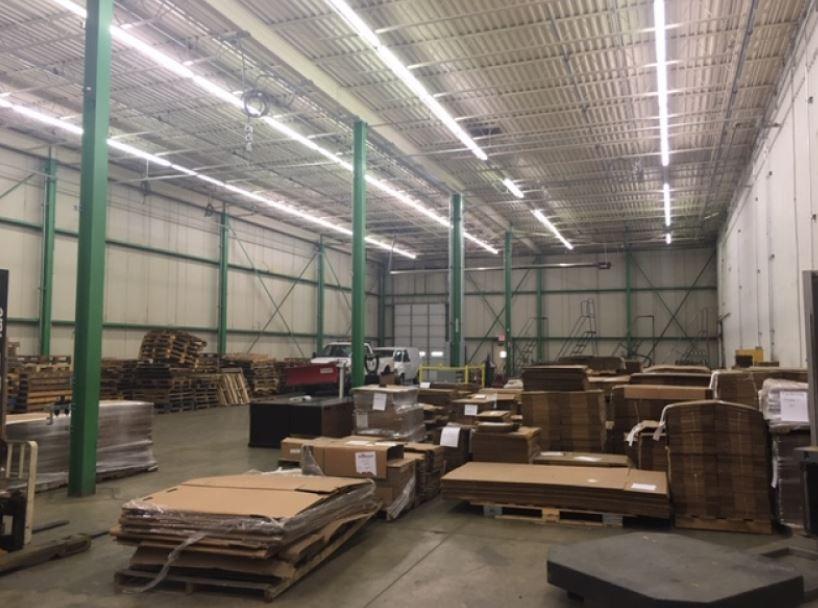
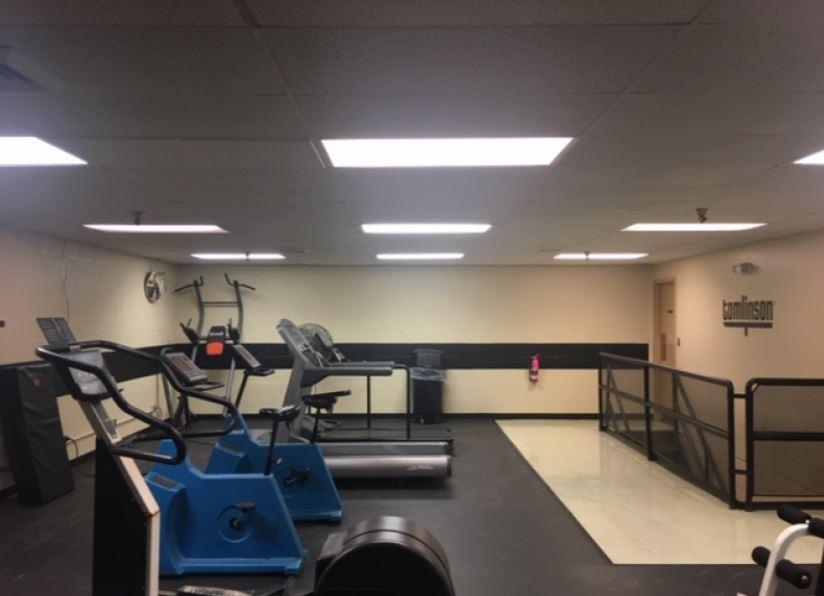
Additional Photos
Listing Agents

David Stover
O: 216-839-2012
DavidStover@HannaCRE.com
O: 216-839-2012
DavidStover@HannaCRE.com
While we strive to provide the most accurate information, all listing information, and demographic data, is provided by third-parties. As such, MyEListing will not be responsible for the accuracy of the information. It is strongly recommended that you verify all information with the listing agent, and any relevant agencies, prior to making any decisions.


