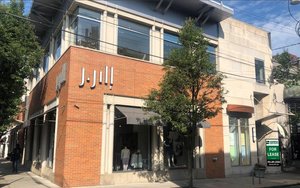
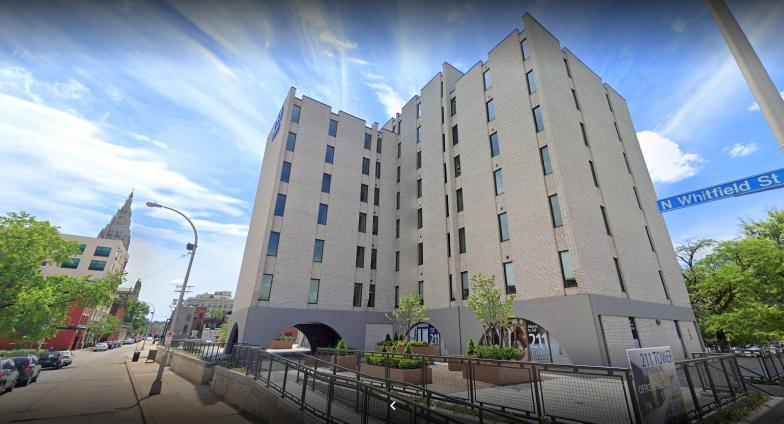
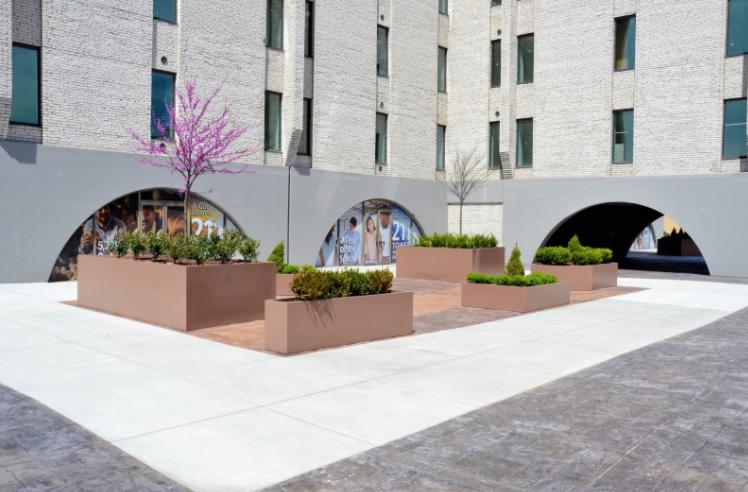
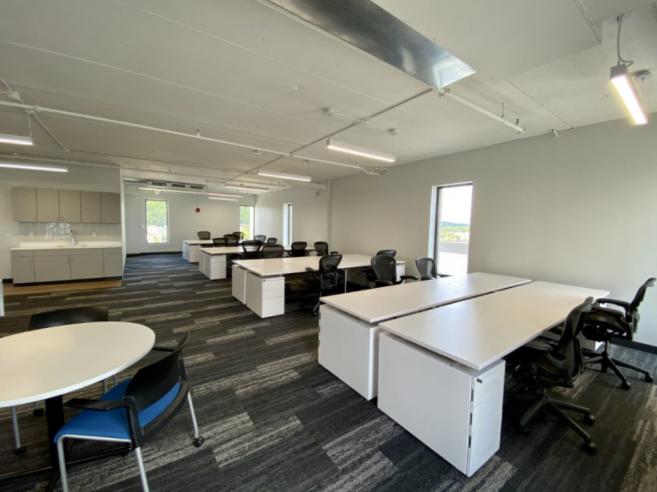
1-Mile | 3-Miles | 5-Miles | ||
---|---|---|---|---|
Total Population | 33,009 | 173,977 | 336,330 | |
Population Median Age | 37 | 38 | 39 | |
Population by Age | 0-9 Yrs | 2418 (7%) | 13743 (7%) | 28799 (8%) |
10-19 Yrs | 2127 (6%) | 20855 (11%) | 37878 (11%) | |
20-29 Yrs | 10529 (31%) | 45208 (25%) | 75184 (22%) | |
30-39 Yrs | 6246 (18%) | 26218 (15%) | 49756 (14%) | |
40-49 Yrs | 2569 (7%) | 14680 (8%) | 31472 (9%) | |
50-59 Yrs | 2933 (8%) | 17136 (9%) | 38420 (11%) | |
60-69 Yrs | 3252 (9%) | 18289 (10%) | 38964 (11%) | |
70+ Yrs | 2934 (8%) | 17849 (10%) | 35857 (10%) | |
Median HH Income | $51,991 | $48,906 | $49,574 | |
Total Household Income | < 24K | 4805 (27%) | 23783 (29%) | 44883 (28%) |
25-49K | 3699 (21%) | 17276 (21%) | 33802 (21%) | |
50-74K | 2705 (15%) | 11592 (14%) | 24453 (15%) | |
75-99K | 2084 (11%) | 8576 (10%) | 16655 (10%) | |
100-199K | 2821 (16%) | 13546 (16%) | 26725 (17%) | |
200K+ | 1418 (8%) | 6172 (7%) | 9949 (6%) | |
Highest Education Level | No Diploma | 1006 | 6450 | 14202 |
Diploma or GED | 3545 | 22750 | 56503 | |
Some College | 2550 | 15114 | 34950 | |
Assoc. Degree | 1373 | 7391 | 18144 | |
Bachelors Degree | 7246 | 30478 | 54833 | |
Higher Degree | 8731 | 34007 | 53901 | |
Total Housing Units | 19,320 | 91,259 | 179,062 | |
--Owner-Occupied | 5,470 | 34,690 | 73,634 | |
--Renter-Occupied | 12,062 | 46,253 | 82,833 | |
Owner-Occupied Values | < 100K | 999 | 9303 | 25353 |
100-199K | 1005 | 9041 | 22579 | |
200-299K | 1049 | 6325 | 11155 | |
300-399K | 946 | 3775 | 5713 | |
400-499K | 596 | 2386 | 3358 | |
500K+ | 876 | 3861 | 5477 | |
Total Working Age Population | 29,405 | 152,707 | 291,758 | |
In Work Force | 20,584 | 97,309 | 185,325 | |
Not In Work Force | 8,821 | 55,398 | 106,432 | |
Workforce Employed | 19,806 | 92,283 | 175,362 | |
Workforce Unemployed | 763 | 4,915 | 9,840 | |
Civlian Workforce | 20,570 | 97,198 | 185,202 | |
Military Workforce | 15 | 111 | 123 | |
Total Households | 17,533 | 80,944 | 156,467 | |
Family Households | 5,690 | 32,315 | 67,245 | |
Non-Family Households | 11,843 | 48,629 | 89,223 | |
Married Couple | 4,059 | 21,978 | 44,022 | |
Other Family | 1,631 | 10,337 | 23,223 | |
Married w/Child | 1,316 | 7,507 | 14,172 | |
Single Male w/Child | 58 | 946 | 2,112 | |
Single Female w/Child | 687 | 3,466 | 8,916 |
Population Change Last Two Decades - Plus Projection
2000 | % | 2010 | % | 2020 | % | 2030 | |
---|---|---|---|---|---|---|---|
Pennsylvania | 12,281,054 | +3 | 12,702,379 | +4 | 13,230,170 | +4 | 13,759,594 |
Allegheny County | 1,281,666 | -5 | 1,223,348 | +3 | 1,265,919 | +3 | 1,307,654 |
Washington County | 202,897 | +2 | 207,820 | 0 | 206,942 | 0 | 207,065 |
Westmoreland County | 369,993 | -1 | 365,169 | -2 | 358,574 | -1 | 354,298 |
Total Working Age Population:
Total Households:
Total Working Age Population:
Total Households:
Total Working Age Population:
Total Households: