Specialty Real Estate
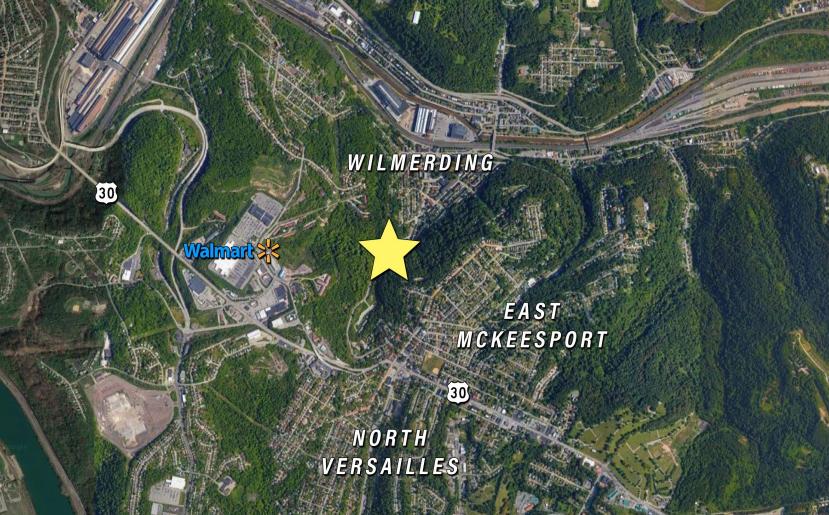
1500 Ice Plant Hill Rd North Versailles, PA 15137
1500 Ice Plant Hill Rd North Versailles, PA 15137
Details & Description
Listing Agents

Michael Connor
O: 412-261-2200
mconnor@HannaLWE.com
O: 412-261-2200
mconnor@HannaLWE.com

Jay Phoebe
O: 412-261-2200
jphoebe@HannaLWE.com
O: 412-261-2200
jphoebe@HannaLWE.com
While we strive to provide the most accurate information, all listing information, and demographic data, is provided by third-parties. As such, MyEListing will not be responsible for the accuracy of the information. It is strongly recommended that you verify all information with the listing agent, and any relevant agencies, prior to making any decisions.


