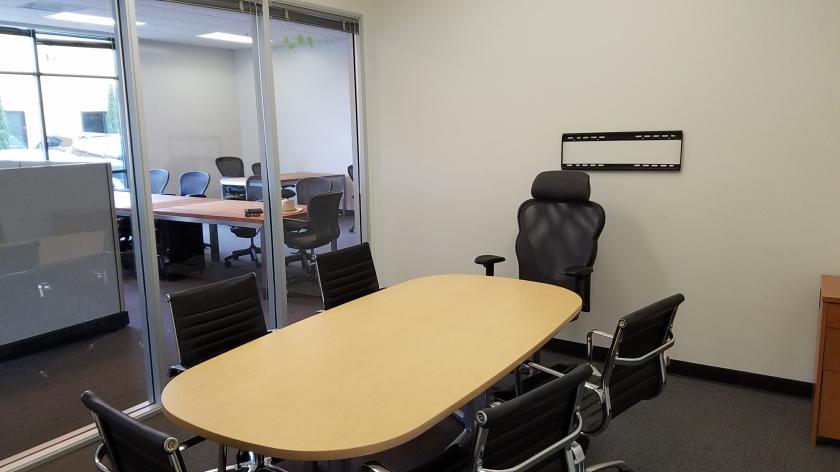
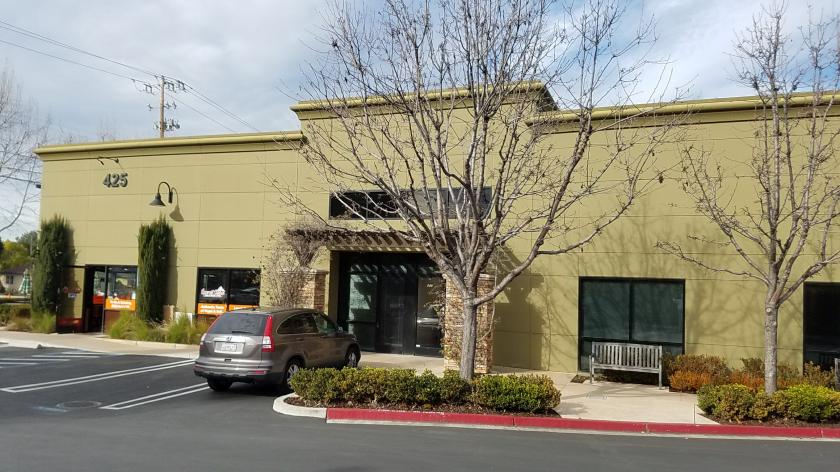
Office Space
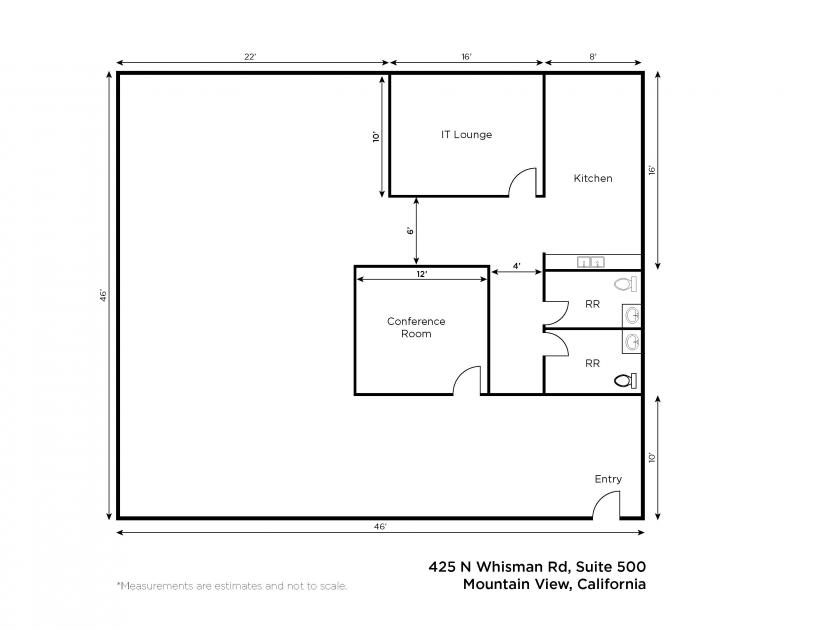
425 North Whisman Road Mountain View, CA 94043
425 North Whisman Road Mountain View, CA 94043
Details & Description
Property Highlights
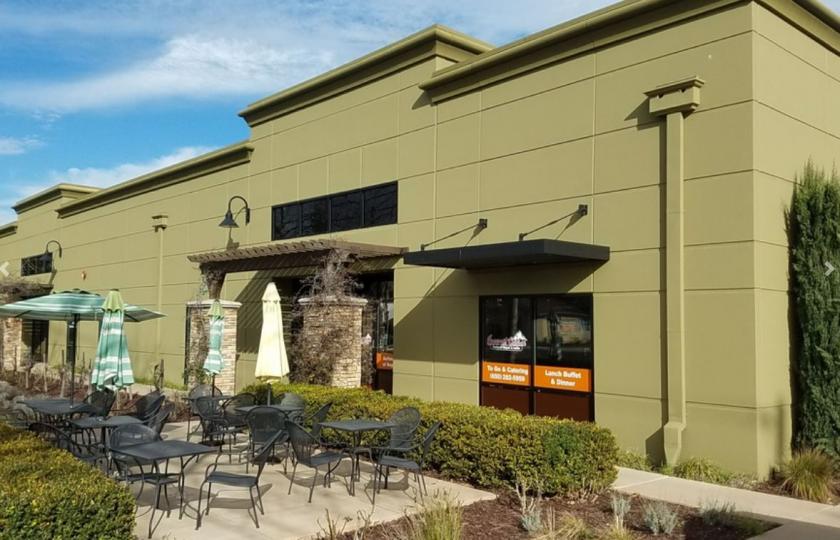
- • Onsite Restaurant
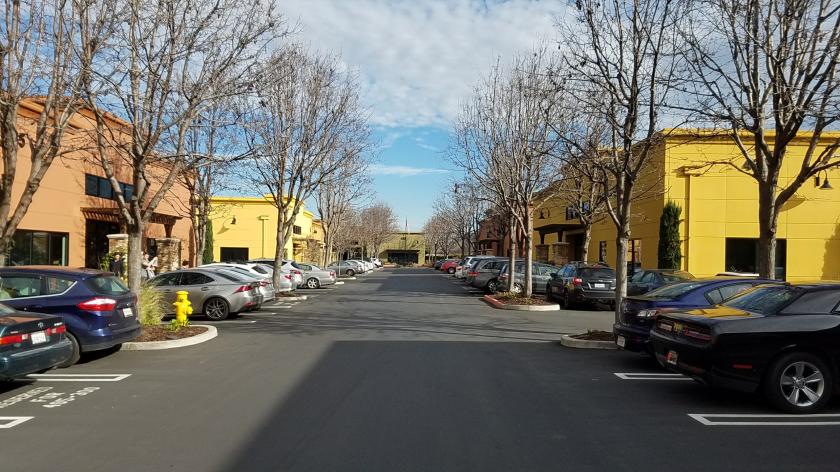
- • Professionally Managed
- • Short walk to Middlefield Light Rail
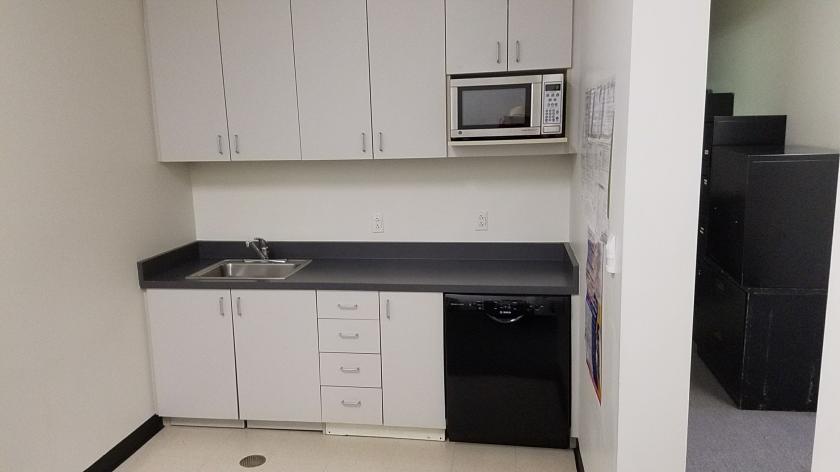
Additional Photos

Listing Agents

Paul Melnyk
O: 408-282-8511
pmelnyk@ritchiecommercial.biz
O: 408-282-8511
pmelnyk@ritchiecommercial.biz
While we strive to provide the most accurate information, all listing information, and demographic data, is provided by third-parties. As such, MyEListing will not be responsible for the accuracy of the information. It is strongly recommended that you verify all information with the listing agent, and any relevant agencies, prior to making any decisions.