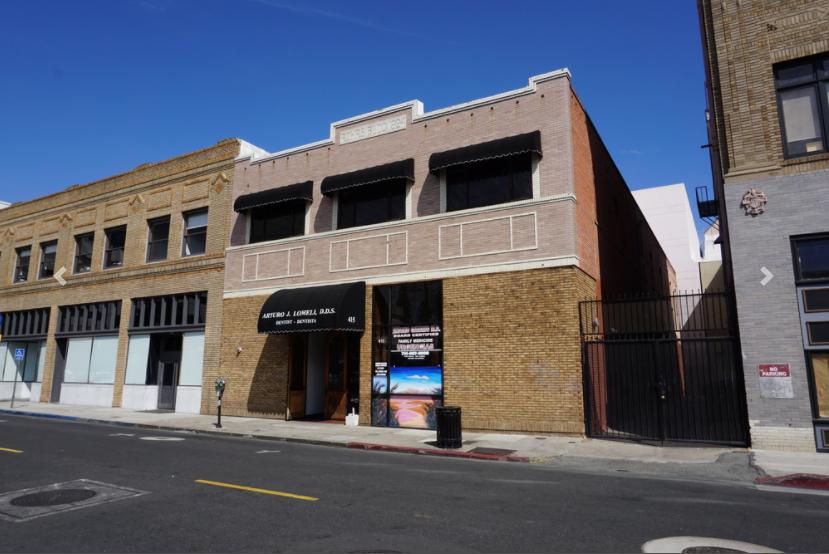
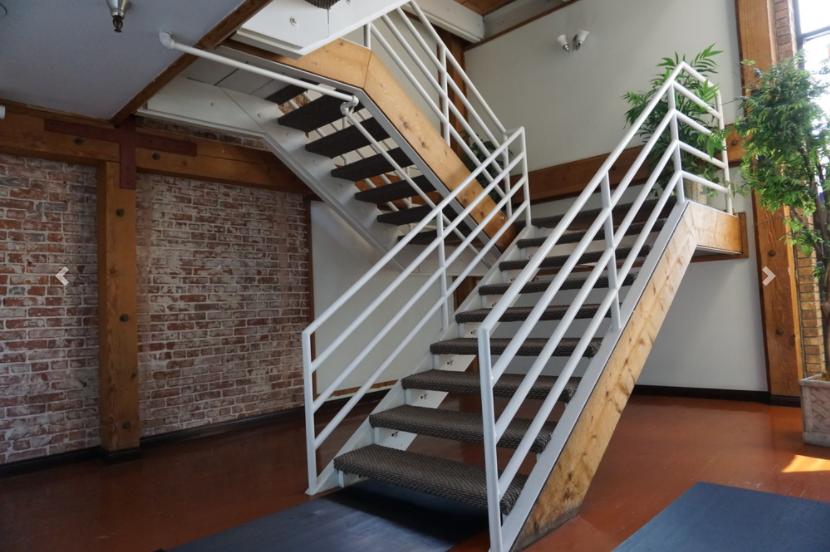
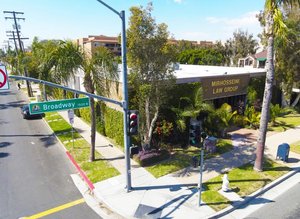
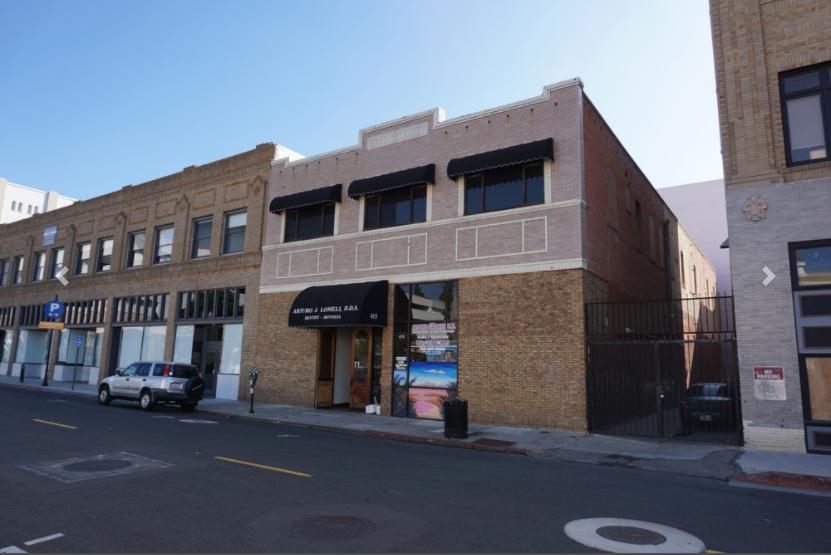
1-Mile | 3-Miles | 5-Miles | ||
---|---|---|---|---|
Total Population | 63,245 | 342,092 | 686,288 | |
Population Median Age | 31 | 34 | 35 | |
Population by Age | 0-9 Yrs | 10780 (17%) | 51142 (14%) | 91786 (13%) |
10-19 Yrs | 10699 (16%) | 51086 (14%) | 94099 (13%) | |
20-29 Yrs | 10340 (16%) | 59871 (17%) | 117686 (17%) | |
30-39 Yrs | 10942 (17%) | 52432 (15%) | 104494 (15%) | |
40-49 Yrs | 8368 (13%) | 44891 (13%) | 90147 (13%) | |
50-59 Yrs | 5960 (9%) | 38932 (11%) | 83626 (12%) | |
60-69 Yrs | 3008 (4%) | 23371 (6%) | 55778 (8%) | |
70+ Yrs | 3148 (4%) | 20366 (5%) | 48673 (7%) | |
Median HH Income | $49,571 | $66,949 | $74,265 | |
Total Household Income | < 24K | 2999 (21%) | 11998 (14%) | 25341 (13%) |
25-49K | 4041 (28%) | 16903 (20%) | 33714 (18%) | |
50-74K | 2905 (20%) | 16794 (20%) | 34392 (18%) | |
75-99K | 1527 (10%) | 11076 (13%) | 26371 (14%) | |
100-199K | 2132 (15%) | 19537 (24%) | 49992 (27%) | |
200K+ | 361 (2%) | 4815 (5%) | 15152 (8%) | |
Highest Education Level | No Diploma | 18909 | 81301 | 127373 |
Diploma or GED | 7963 | 48519 | 94773 | |
Some College | 5486 | 36640 | 83486 | |
Assoc. Degree | 1031 | 10500 | 27022 | |
Bachelors Degree | 2457 | 24779 | 78206 | |
Higher Degree | 1035 | 9867 | 33733 | |
Total Housing Units | 14,451 | 84,188 | 193,289 | |
--Owner-Occupied | 3,130 | 35,060 | 87,269 | |
--Renter-Occupied | 10,836 | 46,062 | 97,694 | |
Owner-Occupied Values | < 100K | 35 | 2439 | 5303 |
100-199K | 151 | 787 | 1702 | |
200-299K | 255 | 2238 | 4097 | |
300-399K | 523 | 4598 | 8509 | |
400-499K | 849 | 7435 | 14012 | |
500K+ | 1318 | 17563 | 53645 | |
Total Working Age Population | 45,719 | 259,591 | 539,309 | |
In Work Force | 29,476 | 174,865 | 361,642 | |
Not In Work Force | 16,244 | 84,726 | 177,667 | |
Workforce Employed | 27,762 | 165,899 | 344,741 | |
Workforce Unemployed | 1,714 | 8,879 | 16,739 | |
Civlian Workforce | 29,476 | 174,777 | 361,480 | |
Military Workforce | 0 | 88 | 162 | |
Total Households | 13,966 | 81,122 | 184,963 | |
Family Households | 11,415 | 64,243 | 138,861 | |
Non-Family Households | 2,551 | 16,879 | 46,102 | |
Married Couple | 7,046 | 43,691 | 97,607 | |
Other Family | 4,368 | 20,552 | 41,254 | |
Married w/Child | 4,476 | 22,599 | 45,614 | |
Single Male w/Child | 635 | 2,712 | 5,244 | |
Single Female w/Child | 1,738 | 6,935 | 12,392 |
Population Change Last Two Decades - Plus Projection
2000 | % | 2010 | % | 2020 | % | 2030 | |
---|---|---|---|---|---|---|---|
California | 33,871,648 | +10 | 37,253,956 | +9 | 40,467,295 | +8 | 43,631,295 |
Los Angeles County | 9,519,338 | +3 | 9,818,605 | +6 | 10,369,367 | +4 | 10,759,850 |
Orange County | 2,846,289 | +6 | 3,010,232 | +8 | 3,257,087 | +5 | 3,431,096 |
Total Working Age Population:
Total Households:
Total Working Age Population:
Total Households:
Total Working Age Population:
Total Households: