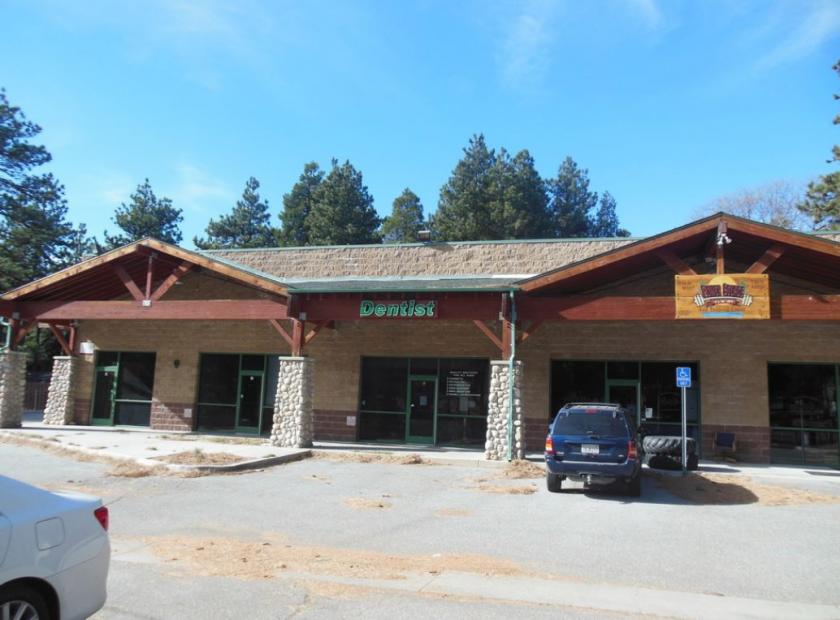
Retail Space
31565 Hilltop Boulevard Running Springs, CA 92382
31565 Hilltop Boulevard Running Springs, CA 92382
Details & Description
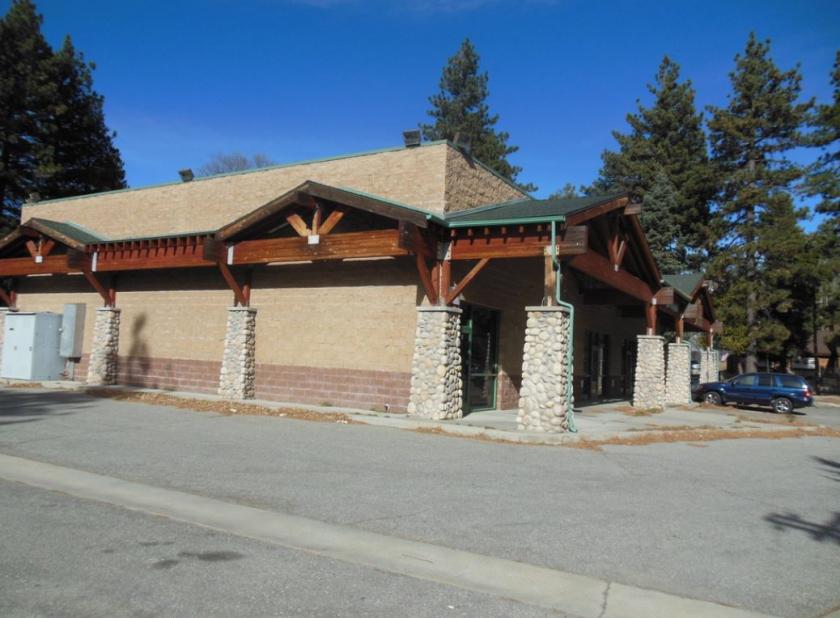
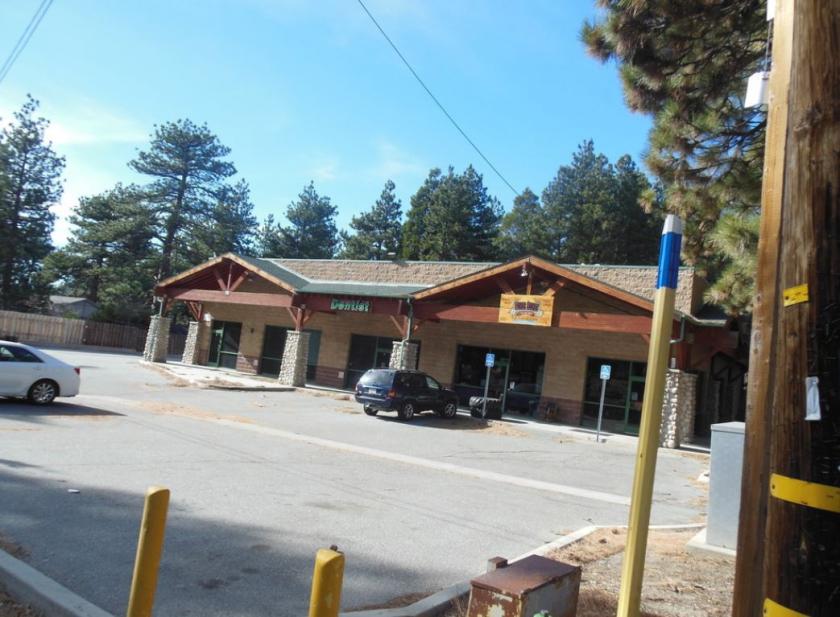
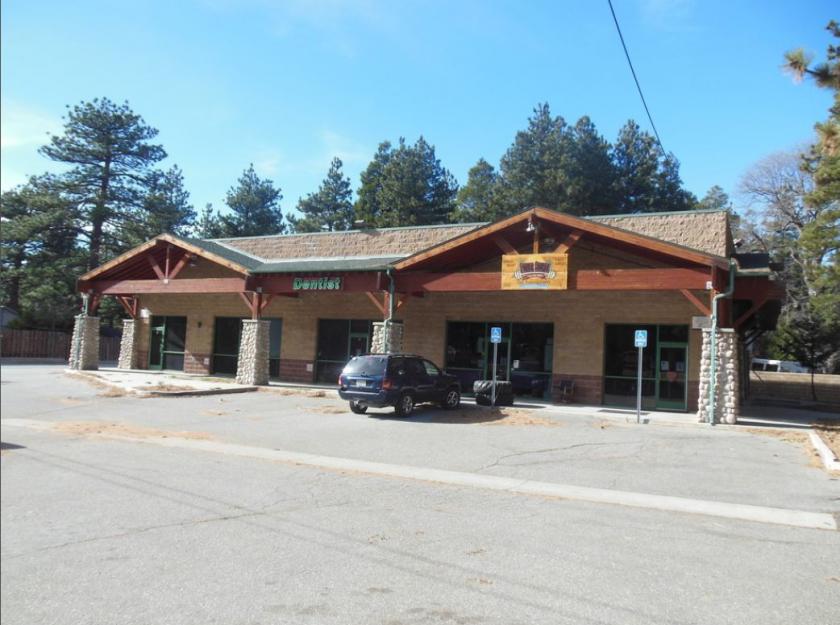
Additional Photos
Listing Agents

Anil Rana
O: 909-270-3355
M: 909-240-9563
anil.rana@svn.com
O: 909-270-3355
M: 909-240-9563
anil.rana@svn.com
While we strive to provide the most accurate information, all listing information, and demographic data, is provided by third-parties. As such, MyEListing will not be responsible for the accuracy of the information. It is strongly recommended that you verify all information with the listing agent, and any relevant agencies, prior to making any decisions.


