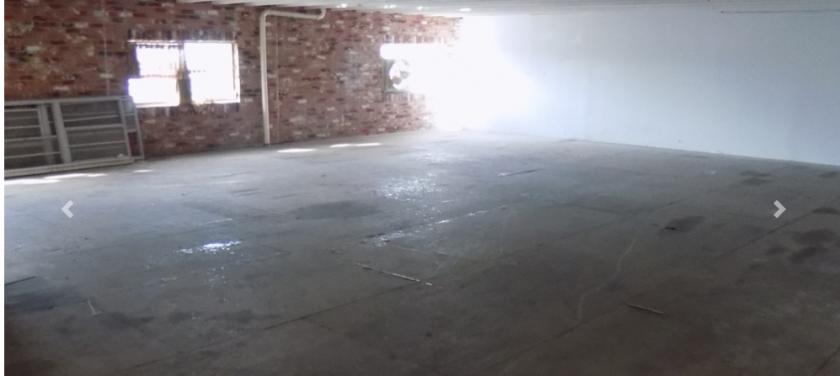
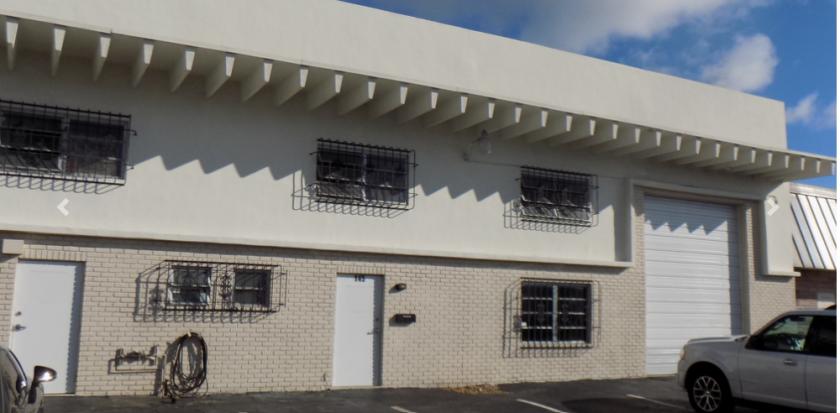
1-Mile | 3-Miles | 5-Miles | ||
---|---|---|---|---|
Total Population | 19,951 | 164,613 | 406,803 | |
Population Median Age | 42 | 42 | 42 | |
Population by Age | 0-9 Yrs | 2023 (10%) | 17590 (10%) | 43241 (10%) |
10-19 Yrs | 1808 (9%) | 15461 (9%) | 40283 (9%) | |
20-29 Yrs | 2324 (11%) | 20167 (12%) | 50524 (12%) | |
30-39 Yrs | 2616 (13%) | 22944 (13%) | 52552 (12%) | |
40-49 Yrs | 3364 (16%) | 22732 (13%) | 50080 (12%) | |
50-59 Yrs | 3104 (15%) | 25172 (15%) | 60975 (14%) | |
60-69 Yrs | 2951 (14%) | 22053 (13%) | 53843 (13%) | |
70+ Yrs | 1761 (8%) | 18494 (11%) | 55305 (13%) | |
Median HH Income | $49,585 | $52,940 | $52,214 | |
Total Household Income | < 24K | 1740 (21%) | 14666 (22%) | 39085 (23%) |
25-49K | 2384 (29%) | 17047 (25%) | 41411 (24%) | |
50-74K | 1460 (17%) | 11767 (17%) | 28908 (17%) | |
75-99K | 973 (11%) | 7332 (11%) | 18121 (10%) | |
100-199K | 1216 (14%) | 10766 (16%) | 26925 (16%) | |
200K+ | 406 (4%) | 5026 (7%) | 12414 (7%) | |
Highest Education Level | No Diploma | 2861 | 17489 | 42592 |
Diploma or GED | 3958 | 33324 | 82328 | |
Some College | 2780 | 23211 | 56561 | |
Assoc. Degree | 1344 | 10289 | 24129 | |
Bachelors Degree | 2796 | 24387 | 58645 | |
Higher Degree | 1438 | 15122 | 38760 | |
Total Housing Units | 9,636 | 80,550 | 221,839 | |
--Owner-Occupied | 3,735 | 34,151 | 90,804 | |
--Renter-Occupied | 4,445 | 32,454 | 76,060 | |
Owner-Occupied Values | < 100K | 338 | 3651 | 11981 |
100-199K | 1094 | 8720 | 21982 | |
200-299K | 624 | 6452 | 16954 | |
300-399K | 896 | 5108 | 12482 | |
400-499K | 419 | 3216 | 8054 | |
500K+ | 363 | 7004 | 19352 | |
Total Working Age Population | 16,853 | 137,647 | 339,452 | |
In Work Force | 12,163 | 91,186 | 213,652 | |
Not In Work Force | 4,691 | 46,460 | 125,800 | |
Workforce Employed | 11,357 | 84,611 | 197,566 | |
Workforce Unemployed | 787 | 6,500 | 15,969 | |
Civlian Workforce | 12,144 | 91,111 | 213,535 | |
Military Workforce | 18 | 75 | 117 | |
Total Households | 8,180 | 66,606 | 166,864 | |
Family Households | 3,375 | 32,908 | 84,930 | |
Non-Family Households | 4,804 | 33,698 | 81,934 | |
Married Couple | 2,122 | 20,519 | 54,803 | |
Other Family | 1,254 | 12,389 | 30,127 | |
Married w/Child | 794 | 6,545 | 15,739 | |
Single Male w/Child | 177 | 1,312 | 2,943 | |
Single Female w/Child | 406 | 4,546 | 10,879 |
Population Change Last Two Decades - Plus Projection
2000 | % | 2010 | % | 2020 | % | 2030 | |
---|---|---|---|---|---|---|---|
Florida | 15,982,378 | +18 | 18,801,310 | +14 | 21,517,610 | +13 | 24,340,457 |
Broward County | 1,623,018 | +8 | 1,748,066 | +11 | 1,942,686 | +9 | 2,120,334 |
Total Working Age Population:
Total Households:
Total Working Age Population:
Total Households:
Total Working Age Population:
Total Households: