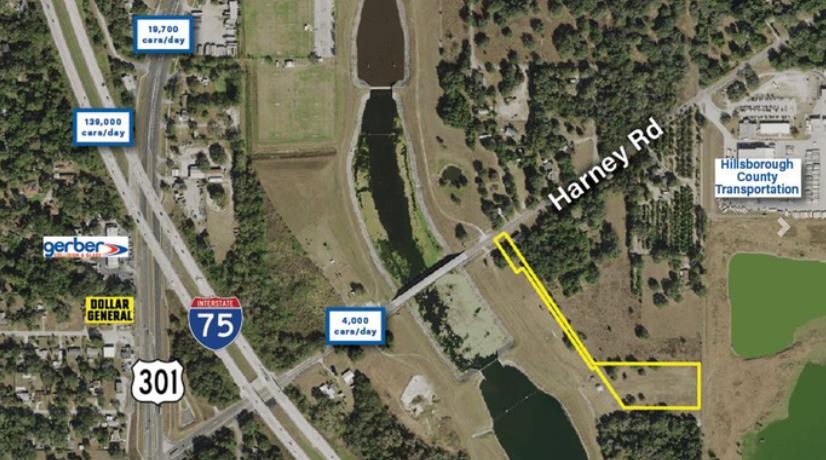
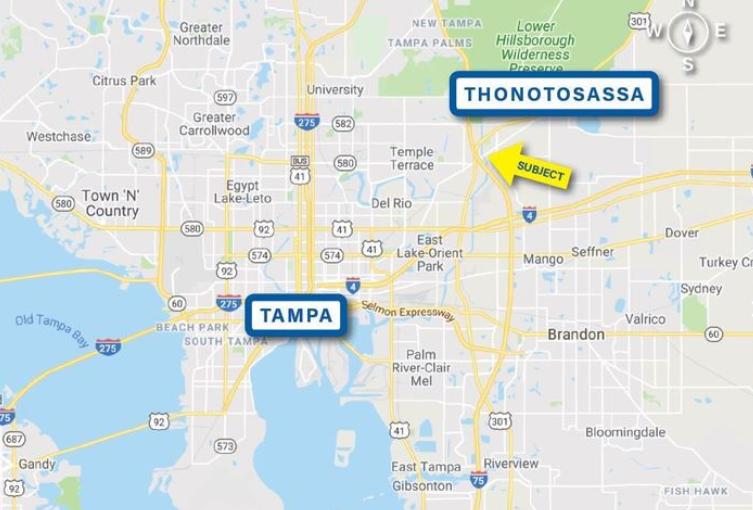
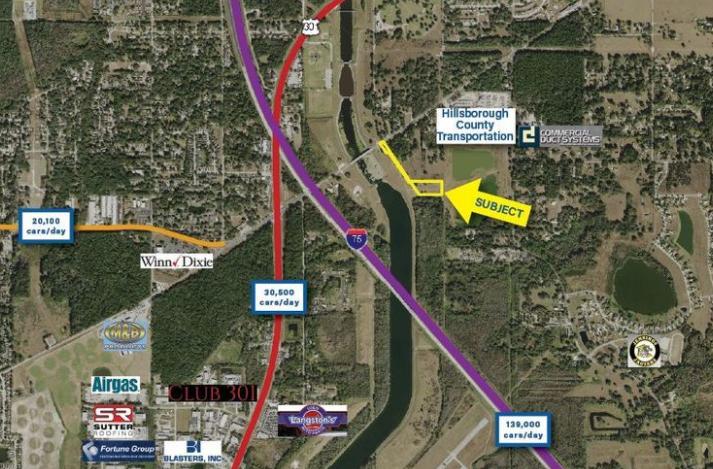
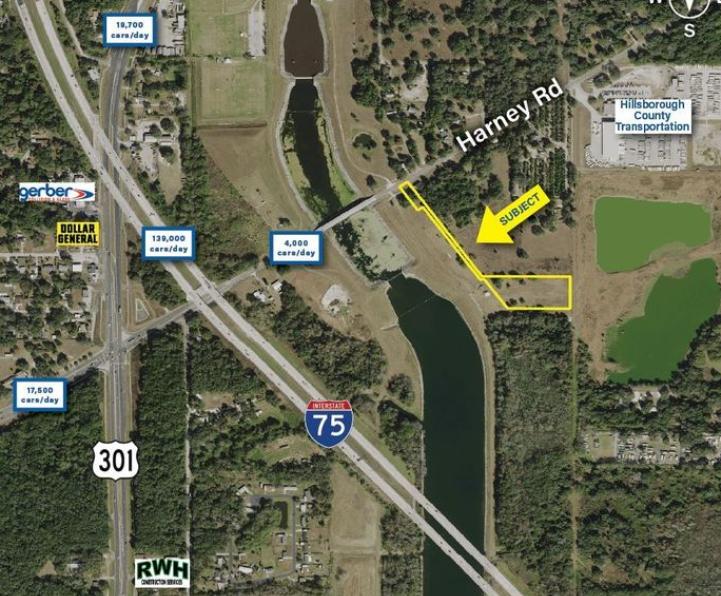
1-Mile | 3-Miles | 5-Miles | ||
---|---|---|---|---|
Total Population | 3,327 | 39,798 | 137,614 | |
Population Median Age | 35 | 36 | 35 | |
Population by Age | 0-9 Yrs | 484 (14%) | 5573 (14%) | 18951 (13%) |
10-19 Yrs | 474 (14%) | 4820 (12%) | 19303 (14%) | |
20-29 Yrs | 546 (16%) | 6941 (17%) | 26297 (19%) | |
30-39 Yrs | 373 (11%) | 6231 (15%) | 20378 (14%) | |
40-49 Yrs | 470 (14%) | 4515 (11%) | 15512 (11%) | |
50-59 Yrs | 430 (12%) | 4592 (11%) | 14660 (10%) | |
60-69 Yrs | 361 (10%) | 4189 (10%) | 13578 (9%) | |
70+ Yrs | 188 (5%) | 2937 (7%) | 8936 (6%) | |
Median HH Income | $48,012 | $52,832 | $43,305 | |
Total Household Income | < 24K | 243 (21%) | 2798 (19%) | 13299 (27%) |
25-49K | 349 (30%) | 3914 (27%) | 14334 (29%) | |
50-74K | 240 (21%) | 2663 (19%) | 8863 (18%) | |
75-99K | 135 (11%) | 1757 (12%) | 5575 (11%) | |
100-199K | 126 (11%) | 2180 (15%) | 5381 (10%) | |
200K+ | 38 (3%) | 703 (5%) | 1561 (3%) | |
Highest Education Level | No Diploma | 350 | 3047 | 11632 |
Diploma or GED | 750 | 6726 | 26198 | |
Some College | 294 | 5019 | 16628 | |
Assoc. Degree | 186 | 2951 | 9125 | |
Bachelors Degree | 312 | 5178 | 14434 | |
Higher Degree | 174 | 3100 | 7780 | |
Total Housing Units | 1,247 | 15,608 | 54,252 | |
--Owner-Occupied | 580 | 7,317 | 21,287 | |
--Renter-Occupied | 549 | 6,697 | 27,726 | |
Owner-Occupied Values | < 100K | 112 | 1904 | 6456 |
100-199K | 278 | 2130 | 7439 | |
200-299K | 99 | 1645 | 4234 | |
300-399K | 57 | 1013 | 1858 | |
400-499K | 12 | 185 | 449 | |
500K+ | 22 | 441 | 851 | |
Total Working Age Population | 2,592 | 31,536 | 108,535 | |
In Work Force | 1,645 | 21,129 | 68,648 | |
Not In Work Force | 948 | 10,406 | 39,888 | |
Workforce Employed | 1,554 | 20,216 | 64,245 | |
Workforce Unemployed | 86 | 877 | 4,270 | |
Civlian Workforce | 1,640 | 21,093 | 68,515 | |
Military Workforce | 4 | 36 | 133 | |
Total Households | 1,130 | 14,014 | 49,013 | |
Family Households | 756 | 8,796 | 28,564 | |
Non-Family Households | 374 | 5,218 | 20,449 | |
Married Couple | 497 | 5,293 | 16,512 | |
Other Family | 259 | 3,503 | 12,052 | |
Married w/Child | 217 | 2,073 | 6,413 | |
Single Male w/Child | 6 | 385 | 1,327 | |
Single Female w/Child | 95 | 1,258 | 5,132 |
Population Change Last Two Decades - Plus Projection
2000 | % | 2010 | % | 2020 | % | 2030 | |
---|---|---|---|---|---|---|---|
Florida | 15,982,378 | +18 | 18,801,310 | +14 | 21,517,610 | +13 | 24,340,457 |
Hillsborough County | 998,948 | +23 | 1,229,226 | +19 | 1,466,803 | +16 | 1,708,550 |
Total Working Age Population:
Total Households:
Total Working Age Population:
Total Households:
Total Working Age Population:
Total Households: