- Suite B: 1,232 SF Retail/Office
- Suite H: 2,710 SF End Cap Retail
- Open Floor Plan
- Ample Parking
- Excellent Visibility with High Traffic Counts
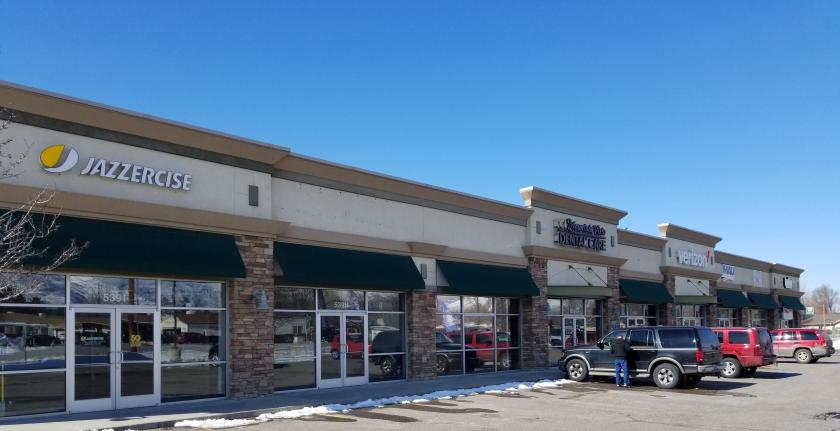
- Co-Tenants Include: Verizon, Mountain Vista Dental Care, MAU & Pho Bahn
- Adjacent to Harrisville Shopping Center Includes: WalMart Super Center, Chili's Grill &Bar, Petco & Hastings
Lease Rate : $22.00/SF Year NNN
509-539 N. Harrisville Road, Ogden, Utah 84404
For more information on this property, please contact Kellen Koncar and Daneile Snelling at 801.617.1700 or by email at kellen.koncar@crcnationwide.com and daneile.snelling@crcnationwide.com. Kellen and Daneile and are licensed real estate agents in the state of Utah and are affiliated with cRc Nationwide Real Estate Brokerage.
No part of this information may be copied, reproduced, repurposed, or screen-captured for any commercial purpose without prior written authorization from MyEListing.
While we strive to provide the most accurate information, all listing information, and demographic data, is provided by third-parties. As such, MyEListing will not be responsible for the accuracy of the information. It is strongly recommended that you verify all information with the listing agent, and any relevant agencies, prior to making any decisions.
What is the asking price for 509 North Harrisville Road in Harrisville?
The asking price for 509 North Harrisville Road is $
What is the building size of this commercial Retail property?
The size of this lease property at '.509 North Harrisville Road.' is 1232 square feet
What kind of Retail is the propery at 509 North Harrisville Road?
The property at 509 North Harrisville Road Harrisville, UT 84404 is listed as a Shopping Center Retail property
What is the population within 1 mile of 509 North Harrisville Road in Harrisville?
The population within 1 mile of 509 North Harrisville Road Harrisville, UT 84404 is 11,503 people.
Who do I contact for questions about 509 North Harrisville Road?
You should contact the listing agent,
Daneile Snelling, for any details regarding this commercial listing.