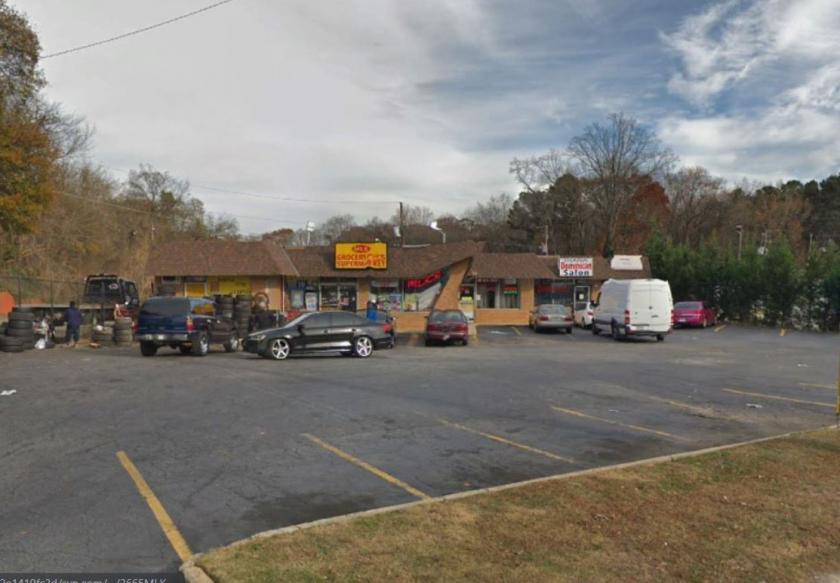
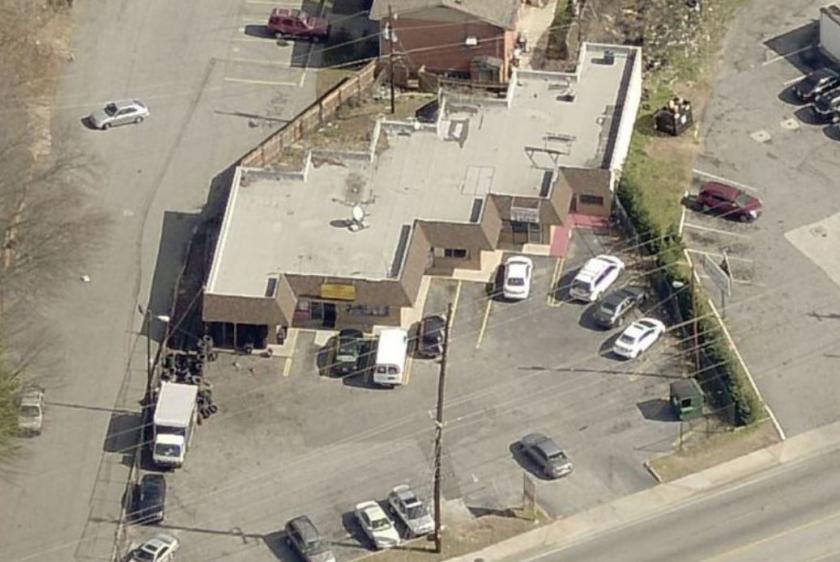
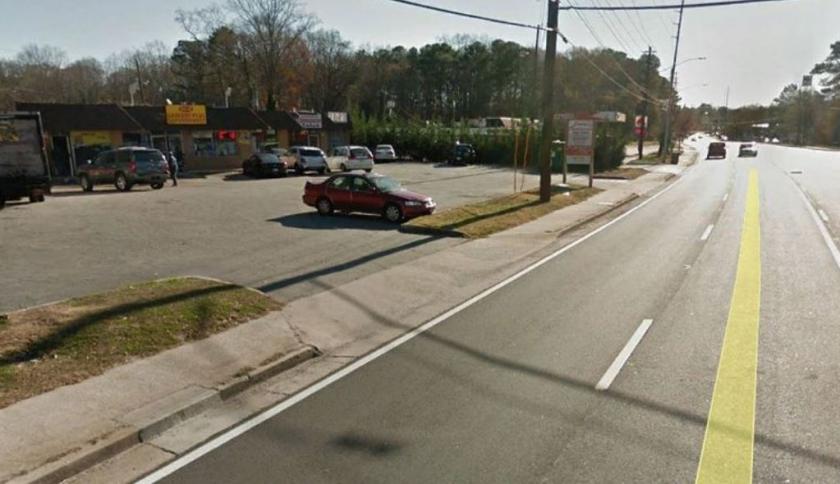
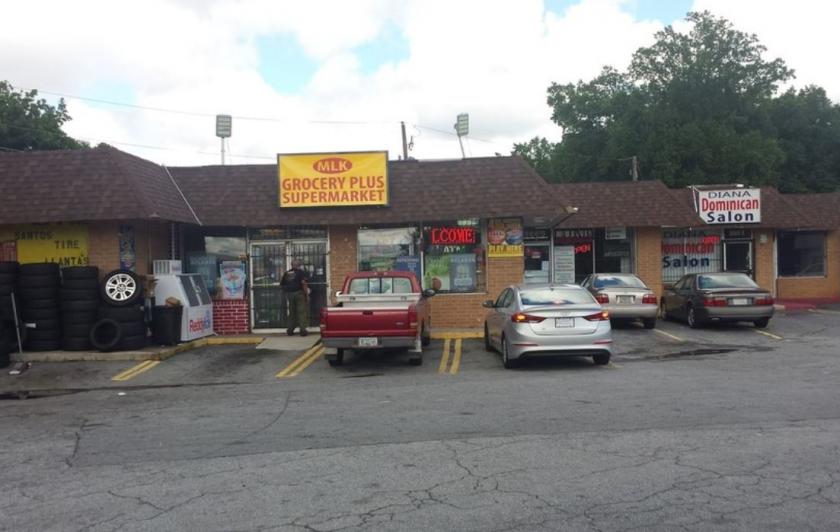
1-Mile | 3-Miles | 5-Miles | ||
---|---|---|---|---|
Total Population | 9,063 | 56,798 | 161,936 | |
Population Median Age | 34 | 37 | 36 | |
Population by Age | 0-9 Yrs | 1597 (17%) | 8572 (15%) | 24728 (15%) |
10-19 Yrs | 1555 (17%) | 8317 (14%) | 21052 (13%) | |
20-29 Yrs | 1536 (16%) | 7600 (13%) | 22635 (13%) | |
30-39 Yrs | 864 (9%) | 7797 (13%) | 22635 (13%) | |
40-49 Yrs | 810 (8%) | 6251 (11%) | 21448 (13%) | |
50-59 Yrs | 1145 (12%) | 7111 (12%) | 19986 (12%) | |
60-69 Yrs | 674 (7%) | 5013 (8%) | 14522 (8%) | |
70+ Yrs | 884 (9%) | 6137 (10%) | 14930 (9%) | |
Median HH Income | $24,899 | $37,952 | $43,624 | |
Total Household Income | < 24K | 1426 (50%) | 7312 (34%) | 17402 (29%) |
25-49K | 663 (23%) | 5750 (27%) | 15619 (26%) | |
50-74K | 441 (15%) | 3461 (16%) | 9838 (16%) | |
75-99K | 158 (5%) | 1362 (6%) | 4919 (8%) | |
100-199K | 148 (5%) | 2509 (11%) | 8796 (14%) | |
200K+ | 7 (0%) | 596 (2%) | 3024 (5%) | |
Highest Education Level | No Diploma | 861 | 5171 | 13809 |
Diploma or GED | 2013 | 11707 | 30859 | |
Some College | 885 | 7325 | 22375 | |
Assoc. Degree | 564 | 2587 | 7006 | |
Bachelors Degree | 426 | 5559 | 19102 | |
Higher Degree | 267 | 3853 | 13414 | |
Total Housing Units | 3,474 | 24,947 | 71,728 | |
--Owner-Occupied | 1,260 | 9,084 | 28,443 | |
--Renter-Occupied | 1,584 | 11,906 | 31,156 | |
Owner-Occupied Values | < 100K | 884 | 3649 | 8476 |
100-199K | 340 | 2822 | 8656 | |
200-299K | 30 | 1212 | 5123 | |
300-399K | 0 | 1027 | 3487 | |
400-499K | 0 | 121 | 1199 | |
500K+ | 6 | 253 | 1501 | |
Total Working Age Population | 6,375 | 43,433 | 124,442 | |
In Work Force | 3,511 | 25,808 | 78,251 | |
Not In Work Force | 2,864 | 17,625 | 46,190 | |
Workforce Employed | 2,964 | 22,837 | 70,082 | |
Workforce Unemployed | 547 | 2,929 | 7,959 | |
Civlian Workforce | 3,511 | 25,766 | 78,041 | |
Military Workforce | 0 | 42 | 210 | |
Total Households | 2,844 | 20,990 | 59,599 | |
Family Households | 1,847 | 11,778 | 34,806 | |
Non-Family Households | 997 | 9,212 | 24,793 | |
Married Couple | 403 | 4,137 | 15,744 | |
Other Family | 1,443 | 7,641 | 19,062 | |
Married w/Child | 38 | 1,245 | 6,115 | |
Single Male w/Child | 57 | 442 | 1,243 | |
Single Female w/Child | 635 | 3,396 | 8,282 |
Population Change Last Two Decades - Plus Projection
2000 | % | 2010 | % | 2020 | % | 2030 | |
---|---|---|---|---|---|---|---|
Georgia | 8,186,453 | +18 | 9,687,653 | +12 | 10,833,472 | +13 | 12,292,423 |
Cobb County | 607,751 | +13 | 688,078 | +15 | 790,588 | +19 | 938,747 |
Douglas County | 92,174 | +44 | 132,403 | +15 | 151,906 | +20 | 182,157 |
Fulton County | 816,006 | +13 | 920,581 | +19 | 1,099,181 | +18 | 1,300,861 |
Total Working Age Population:
Total Households:
Total Working Age Population:
Total Households:
Total Working Age Population:
Total Households: