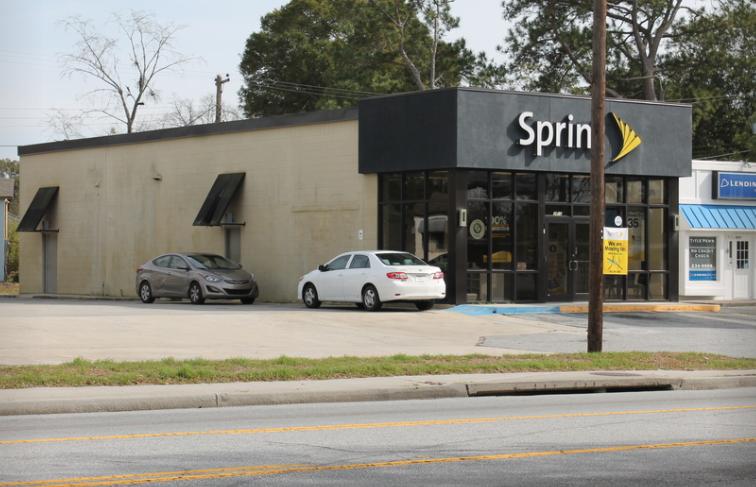
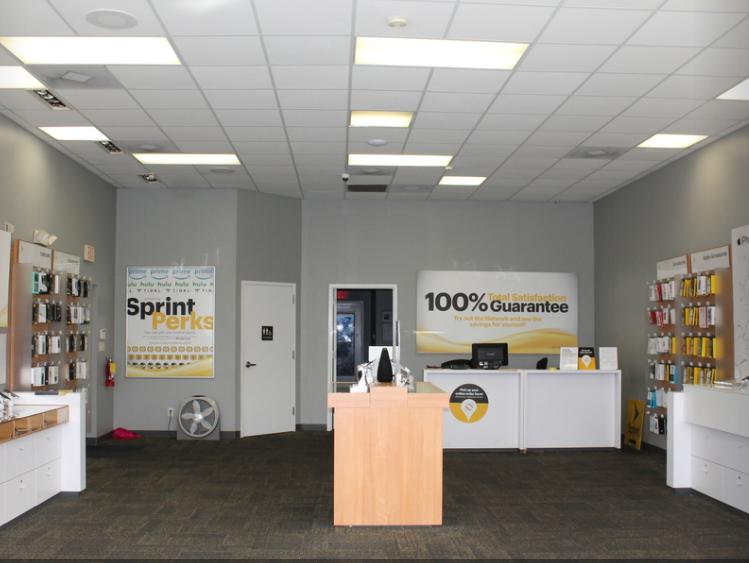
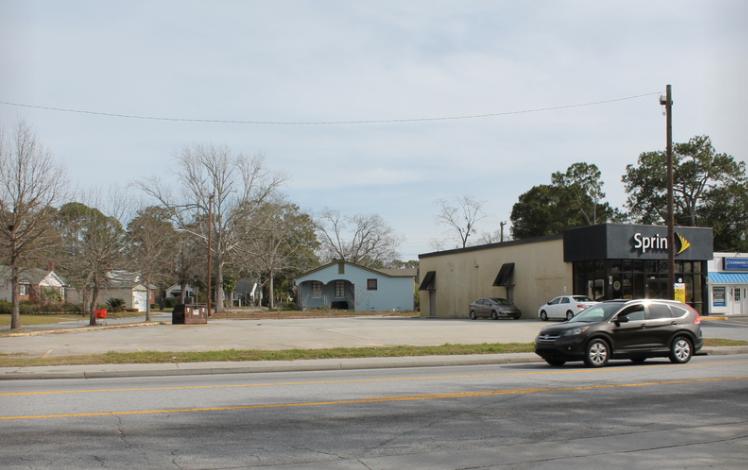
1-Mile | 3-Miles | 5-Miles | ||
---|---|---|---|---|
Total Population | 11,154 | 73,630 | 122,990 | |
Population Median Age | 36 | 37 | 37 | |
Population by Age | 0-9 Yrs | 1515 (13%) | 8496 (11%) | 15589 (12%) |
10-19 Yrs | 1384 (12%) | 8542 (11%) | 15764 (12%) | |
20-29 Yrs | 2026 (18%) | 15412 (20%) | 23047 (18%) | |
30-39 Yrs | 1716 (15%) | 9958 (13%) | 16454 (13%) | |
40-49 Yrs | 1201 (10%) | 7599 (10%) | 12401 (10%) | |
50-59 Yrs | 1196 (10%) | 8491 (11%) | 14636 (11%) | |
60-69 Yrs | 1086 (9%) | 7961 (10%) | 12808 (10%) | |
70+ Yrs | 1029 (9%) | 7172 (9%) | 12291 (9%) | |
Median HH Income | $38,778 | $44,495 | $45,055 | |
Total Household Income | < 24K | 1293 (30%) | 8515 (30%) | 13571 (29%) |
25-49K | 1290 (30%) | 7025 (24%) | 11175 (24%) | |
50-74K | 716 (17%) | 4809 (16%) | 7842 (17%) | |
75-99K | 420 (9%) | 2789 (9%) | 4524 (9%) | |
100-199K | 469 (11%) | 3776 (13%) | 6090 (13%) | |
200K+ | 23 (0%) | 1392 (4%) | 2491 (5%) | |
Highest Education Level | No Diploma | 957 | 5518 | 9745 |
Diploma or GED | 2287 | 12127 | 20139 | |
Some College | 1742 | 11596 | 19799 | |
Assoc. Degree | 443 | 3268 | 5140 | |
Bachelors Degree | 1067 | 9503 | 15077 | |
Higher Degree | 629 | 6481 | 10011 | |
Total Housing Units | 4,756 | 33,841 | 54,145 | |
--Owner-Occupied | 1,883 | 13,135 | 22,198 | |
--Renter-Occupied | 2,328 | 15,170 | 23,495 | |
Owner-Occupied Values | < 100K | 650 | 3225 | 5380 |
100-199K | 852 | 3789 | 6811 | |
200-299K | 256 | 2388 | 3632 | |
300-399K | 75 | 1282 | 2115 | |
400-499K | 18 | 692 | 1219 | |
500K+ | 32 | 1759 | 3042 | |
Total Working Age Population | 8,742 | 60,369 | 98,961 | |
In Work Force | 6,017 | 39,622 | 63,869 | |
Not In Work Force | 2,725 | 20,747 | 35,092 | |
Workforce Employed | 5,431 | 36,283 | 57,591 | |
Workforce Unemployed | 569 | 3,175 | 5,609 | |
Civlian Workforce | 6,000 | 39,458 | 63,200 | |
Military Workforce | 17 | 165 | 669 | |
Total Households | 4,211 | 28,305 | 45,693 | |
Family Households | 2,483 | 15,339 | 26,178 | |
Non-Family Households | 1,728 | 12,966 | 19,515 | |
Married Couple | 1,277 | 8,238 | 14,269 | |
Other Family | 1,206 | 7,101 | 11,909 | |
Married w/Child | 355 | 2,397 | 4,522 | |
Single Male w/Child | 67 | 518 | 810 | |
Single Female w/Child | 616 | 3,029 | 5,419 |
Population Change Last Two Decades - Plus Projection
2000 | % | 2010 | % | 2020 | % | 2030 | |
---|---|---|---|---|---|---|---|
Georgia | 8,186,453 | +18 | 9,687,653 | +12 | 10,833,472 | +13 | 12,292,423 |
Bryan County | 23,417 | +29 | 30,233 | +29 | 39,137 | +13 | 44,300 |
Chatham County | 232,048 | +14 | 265,128 | +10 | 292,176 | +7 | 313,387 |
Effingham County | 37,535 | +39 | 52,250 | +23 | 64,026 | +13 | 72,294 |
Liberty County | 61,610 | +3 | 63,453 | -2 | 61,904 | +1 | 62,286 |
South Carolina | 4,012,012 | +15 | 4,625,364 | +9 | 5,020,400 | +9 | 5,488,460 |
Beaufort County | 120,937 | +34 | 162,233 | +14 | 185,220 | +16 | 215,270 |
Jasper County | 20,678 | +20 | 24,777 | +5 | 26,130 | +11 | 29,000 |
Total Working Age Population:
Total Households:
Total Working Age Population:
Total Households:
Total Working Age Population:
Total Households: