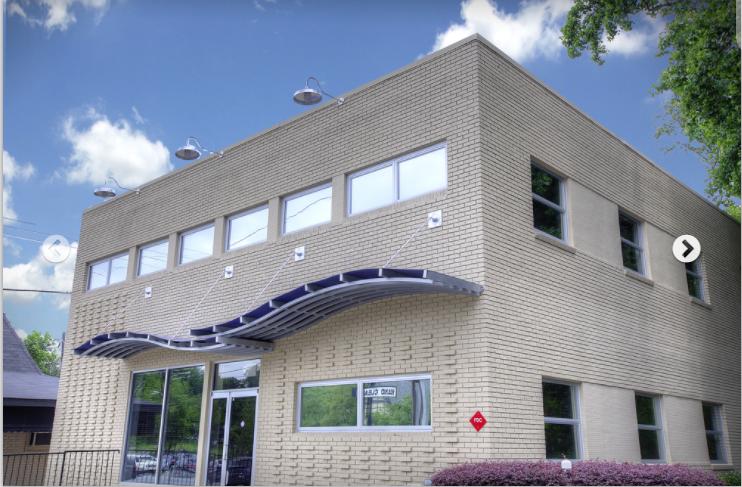
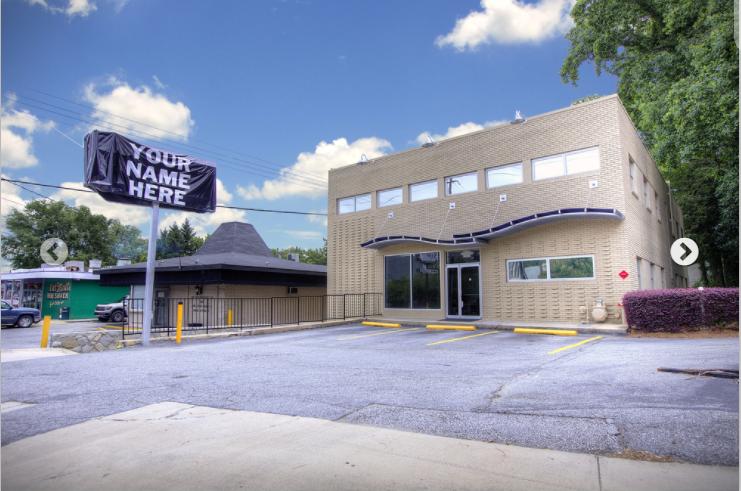
Advertise your company with freestanding building with monument sign and bldg signage opportunities
• Well located on Piedmont Avenue on main corridor between Midtown and Buckhead
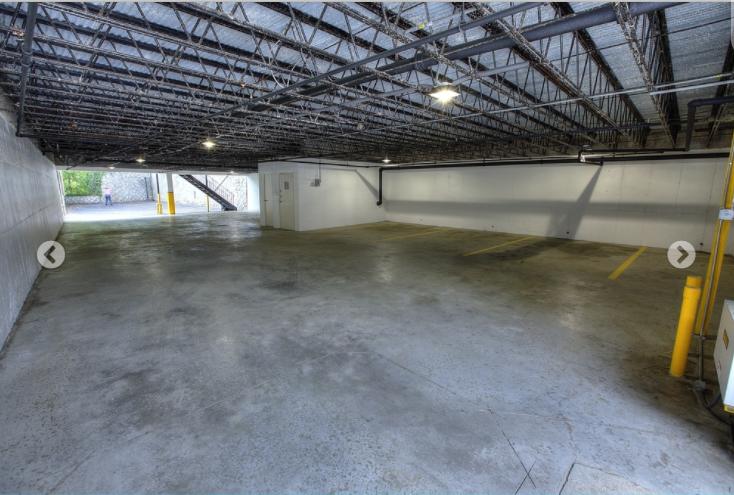
• Check out the bat cave covered parking garage with gated entrance
• Over 24,400 cars per day see your company name and message board lit signage
• Convenient location; quick access to GA-400, I-75 and I-85
• New developments on both sides of building, across the street and in immediate area
• Multiple dining opportunities within one block
• Available March 1, 2022
No part of this information may be copied, reproduced, repurposed, or screen-captured for any commercial purpose without prior written authorization from MyEListing.
While we strive to provide the most accurate information, all listing information, and demographic data, is provided by third-parties. As such, MyEListing will not be responsible for the accuracy of the information. It is strongly recommended that you verify all information with the listing agent, and any relevant agencies, prior to making any decisions.
What is the asking price for 1801 Piedmont Avenue Northeast in Atlanta?
The asking price for 1801 Piedmont Avenue Northeast is $26.00 a SF per Year
What is the building size of this commercial Retail property?
The size of this lease property at '.1801 Piedmont Avenue Northeast.' is 7300 square feet
What kind of Retail is the propery at 1801 Piedmont Avenue Northeast?
The property at 1801 Piedmont Avenue Northeast Atlanta, GA 30324 is listed as a Free Standing Building Retail property
What is the population within 1 mile of 1801 Piedmont Avenue Northeast in Atlanta?
The population within 1 mile of 1801 Piedmont Avenue Northeast Atlanta, GA 30324 is 13,401 people.
Who do I contact for questions about 1801 Piedmont Avenue Northeast?
You should contact the listing agent,
Michael Bull, for any details regarding this commercial listing.