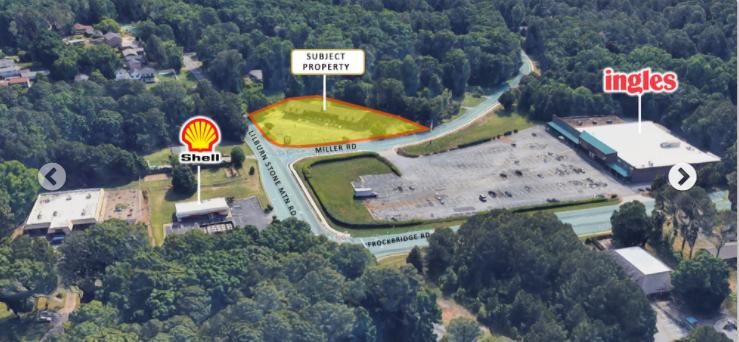
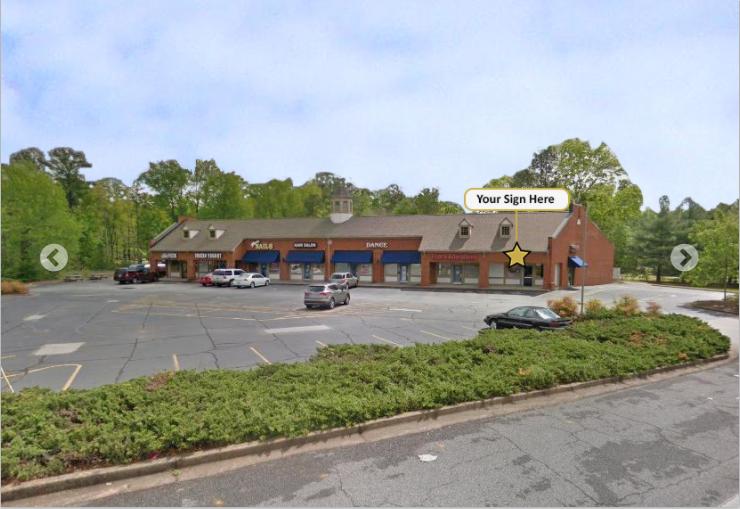
1-Mile | 3-Miles | 5-Miles | ||
---|---|---|---|---|
Total Population | 6,086 | 54,349 | 199,455 | |
Population Median Age | 41 | 39 | 36 | |
Population by Age | 0-9 Yrs | 659 (10%) | 6862 (12%) | 27495 (13%) |
10-19 Yrs | 823 (13%) | 7701 (14%) | 28224 (14%) | |
20-29 Yrs | 710 (11%) | 5923 (10%) | 27456 (13%) | |
30-39 Yrs | 708 (11%) | 6784 (12%) | 30597 (15%) | |
40-49 Yrs | 696 (11%) | 7041 (12%) | 26456 (13%) | |
50-59 Yrs | 893 (14%) | 7912 (14%) | 25994 (13%) | |
60-69 Yrs | 895 (14%) | 6615 (12%) | 18677 (9%) | |
70+ Yrs | 702 (11%) | 5511 (10%) | 14555 (7%) | |
Median HH Income | $85,106 | $79,374 | $59,370 | |
Total Household Income | < 24K | 216 (10%) | 2105 (11%) | 10989 (16%) |
25-49K | 349 (17%) | 3469 (19%) | 16493 (24%) | |
50-74K | 300 (14%) | 3042 (16%) | 13505 (20%) | |
75-99K | 396 (19%) | 2654 (14%) | 8513 (12%) | |
100-199K | 681 (33%) | 5385 (29%) | 13921 (20%) | |
200K+ | 108 (5%) | 1507 (8%) | 3244 (4%) | |
Highest Education Level | No Diploma | 399 | 4688 | 23958 |
Diploma or GED | 609 | 6446 | 30051 | |
Some College | 921 | 6775 | 22753 | |
Assoc. Degree | 367 | 3135 | 10679 | |
Bachelors Degree | 1114 | 9769 | 27329 | |
Higher Degree | 747 | 6127 | 16122 | |
Total Housing Units | 2,112 | 18,948 | 71,407 | |
--Owner-Occupied | 1,895 | 14,412 | 39,532 | |
--Renter-Occupied | 157 | 3,750 | 27,132 | |
Owner-Occupied Values | < 100K | 102 | 780 | 4650 |
100-199K | 849 | 5548 | 16518 | |
200-299K | 626 | 4553 | 11395 | |
300-399K | 178 | 2324 | 4781 | |
400-499K | 77 | 685 | 1140 | |
500K+ | 63 | 523 | 1048 | |
Total Working Age Population | 4,830 | 42,493 | 154,221 | |
In Work Force | 3,140 | 28,175 | 105,621 | |
Not In Work Force | 1,690 | 14,318 | 48,599 | |
Workforce Employed | 3,010 | 27,038 | 101,223 | |
Workforce Unemployed | 128 | 1,130 | 4,345 | |
Civlian Workforce | 3,138 | 28,168 | 105,568 | |
Military Workforce | 2 | 7 | 53 | |
Total Households | 2,051 | 18,163 | 66,665 | |
Family Households | 1,687 | 13,966 | 46,631 | |
Non-Family Households | 364 | 4,197 | 20,034 | |
Married Couple | 1,364 | 11,209 | 32,535 | |
Other Family | 323 | 2,757 | 14,095 | |
Married w/Child | 510 | 4,654 | 14,450 | |
Single Male w/Child | 39 | 346 | 1,558 | |
Single Female w/Child | 116 | 1,070 | 5,890 |
Population Change Last Two Decades - Plus Projection
2000 | % | 2010 | % | 2020 | % | 2030 | |
---|---|---|---|---|---|---|---|
Georgia | 8,186,453 | +18 | 9,687,653 | +12 | 10,833,472 | +13 | 12,292,423 |
DeKalb County | 665,865 | +4 | 691,893 | +15 | 793,154 | +19 | 944,045 |
Fulton County | 816,006 | +13 | 920,581 | +19 | 1,099,181 | +18 | 1,300,861 |
Gwinnett County | 588,448 | +37 | 805,321 | +21 | 971,145 | +21 | 1,175,358 |
Rockdale County | 70,111 | +22 | 85,215 | +11 | 94,960 | +18 | 112,165 |
Total Working Age Population:
Total Households:
Total Working Age Population:
Total Households:
Total Working Age Population:
Total Households: