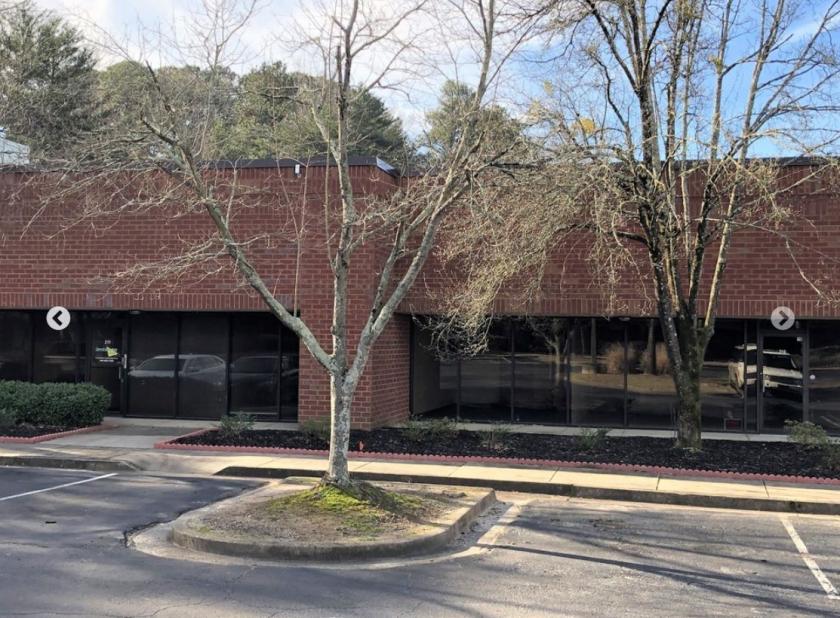
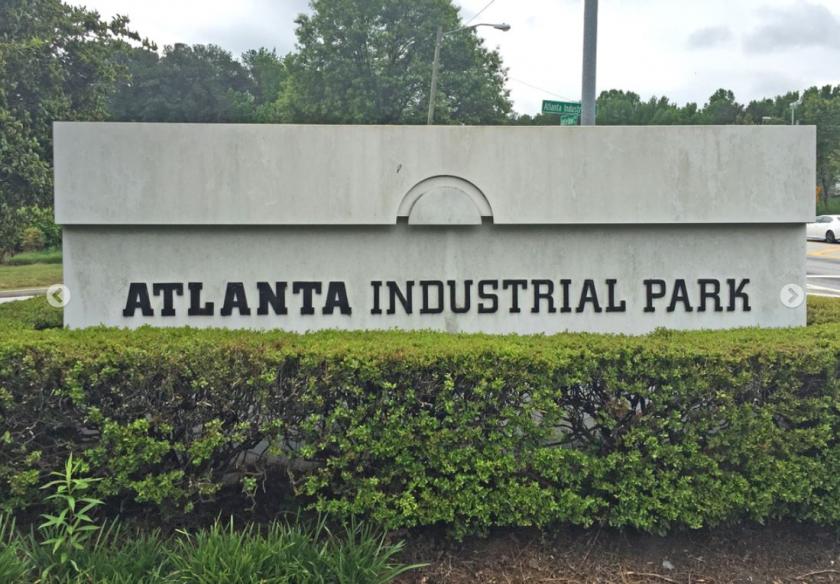
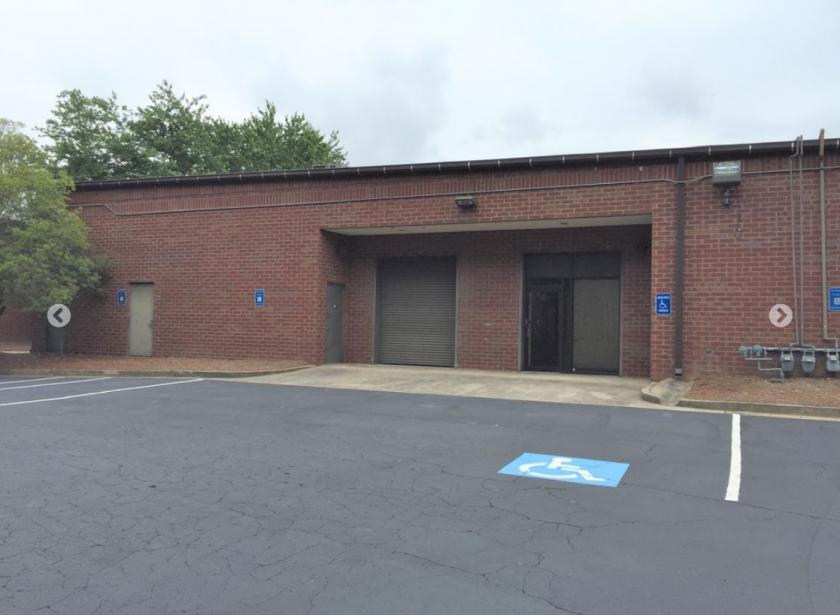
1-Mile | 3-Miles | 5-Miles | ||
---|---|---|---|---|
Total Population | 3,471 | 57,345 | 178,849 | |
Population Median Age | 37 | 35 | 37 | |
Population by Age | 0-9 Yrs | 563 (16%) | 9414 (16%) | 24842 (13%) |
10-19 Yrs | 526 (15%) | 7925 (13%) | 20801 (11%) | |
20-29 Yrs | 402 (11%) | 8397 (14%) | 28172 (15%) | |
30-39 Yrs | 540 (15%) | 8846 (15%) | 28902 (16%) | |
40-49 Yrs | 371 (10%) | 7124 (12%) | 23905 (13%) | |
50-59 Yrs | 296 (8%) | 6309 (11%) | 21359 (11%) | |
60-69 Yrs | 352 (10%) | 4242 (7%) | 15226 (8%) | |
70+ Yrs | 421 (12%) | 5089 (8%) | 15642 (8%) | |
Median HH Income | $38,698 | $44,760 | $59,365 | |
Total Household Income | < 24K | 336 (25%) | 6427 (29%) | 15566 (22%) |
25-49K | 547 (40%) | 5180 (23%) | 15063 (21%) | |
50-74K | 187 (13%) | 3052 (14%) | 11654 (16%) | |
75-99K | 74 (5%) | 1600 (7%) | 7038 (10%) | |
100-199K | 157 (11%) | 3909 (18%) | 13951 (19%) | |
200K+ | 36 (2%) | 1515 (6%) | 6986 (9%) | |
Highest Education Level | No Diploma | 226 | 4267 | 11938 |
Diploma or GED | 592 | 9990 | 27277 | |
Some College | 532 | 6857 | 22736 | |
Assoc. Degree | 165 | 2358 | 7473 | |
Bachelors Degree | 435 | 7662 | 30813 | |
Higher Degree | 232 | 5167 | 21542 | |
Total Housing Units | 1,494 | 25,890 | 82,370 | |
--Owner-Occupied | 526 | 10,354 | 35,179 | |
--Renter-Occupied | 812 | 11,329 | 35,078 | |
Owner-Occupied Values | < 100K | 218 | 2954 | 6806 |
100-199K | 116 | 2017 | 8387 | |
200-299K | 142 | 2346 | 6778 | |
300-399K | 34 | 1809 | 5257 | |
400-499K | 4 | 601 | 2633 | |
500K+ | 13 | 627 | 5318 | |
Total Working Age Population | 2,606 | 43,050 | 141,765 | |
In Work Force | 1,513 | 27,952 | 94,114 | |
Not In Work Force | 1,092 | 15,098 | 47,651 | |
Workforce Employed | 1,371 | 25,155 | 86,923 | |
Workforce Unemployed | 140 | 2,725 | 6,940 | |
Civlian Workforce | 1,511 | 27,880 | 93,863 | |
Military Workforce | 3 | 72 | 251 | |
Total Households | 1,338 | 21,682 | 70,257 | |
Family Households | 805 | 12,626 | 39,062 | |
Non-Family Households | 533 | 9,057 | 31,195 | |
Married Couple | 270 | 5,697 | 22,127 | |
Other Family | 534 | 6,929 | 16,935 | |
Married w/Child | 58 | 2,204 | 9,032 | |
Single Male w/Child | 76 | 460 | 1,237 | |
Single Female w/Child | 264 | 3,533 | 7,394 |
Population Change Last Two Decades - Plus Projection
2000 | % | 2010 | % | 2020 | % | 2030 | |
---|---|---|---|---|---|---|---|
Georgia | 8,186,453 | +18 | 9,687,653 | +12 | 10,833,472 | +13 | 12,292,423 |
Cobb County | 607,751 | +13 | 688,078 | +15 | 790,588 | +19 | 938,747 |
Douglas County | 92,174 | +44 | 132,403 | +15 | 151,906 | +20 | 182,157 |
Fulton County | 816,006 | +13 | 920,581 | +19 | 1,099,181 | +18 | 1,300,861 |
Total Working Age Population:
Total Households:
Total Working Age Population:
Total Households:
Total Working Age Population:
Total Households: