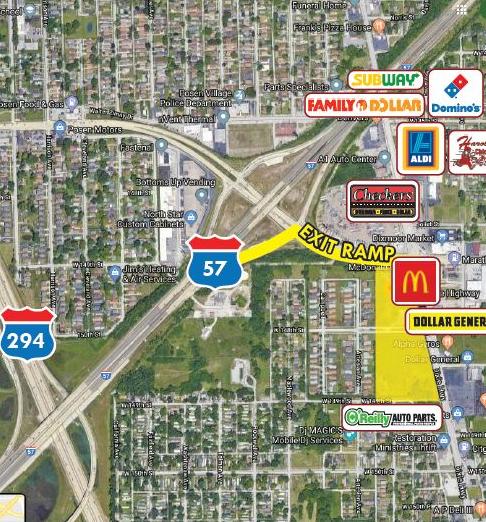
1-Mile | 3-Miles | 5-Miles | ||
---|---|---|---|---|
Total Population | 11,826 | 97,901 | 291,882 | |
Population Median Age | 36 | 37 | 38 | |
Population by Age | 0-9 Yrs | 1774 (15%) | 12591 (12%) | 36647 (12%) |
10-19 Yrs | 2016 (17%) | 15020 (15%) | 43272 (14%) | |
20-29 Yrs | 1316 (11%) | 13844 (14%) | 40284 (13%) | |
30-39 Yrs | 1403 (11%) | 11579 (11%) | 35090 (12%) | |
40-49 Yrs | 1739 (14%) | 13122 (13%) | 37090 (12%) | |
50-59 Yrs | 1432 (12%) | 12764 (13%) | 38652 (13%) | |
60-69 Yrs | 1102 (9%) | 10599 (10%) | 33358 (11%) | |
70+ Yrs | 1044 (8%) | 8382 (8%) | 27489 (9%) | |
Median HH Income | $37,521 | $41,660 | $50,532 | |
Total Household Income | < 24K | 1294 (33%) | 10664 (31%) | 26363 (25%) |
25-49K | 1064 (27%) | 9275 (27%) | 25643 (24%) | |
50-74K | 718 (18%) | 5902 (17%) | 19017 (18%) | |
75-99K | 444 (11%) | 3587 (10%) | 13059 (12%) | |
100-199K | 348 (8%) | 4231 (12%) | 18213 (17%) | |
200K+ | 53 (1%) | 556 (1%) | 2598 (2%) | |
Highest Education Level | No Diploma | 1655 | 10905 | 23514 |
Diploma or GED | 2283 | 21503 | 57047 | |
Some College | 1883 | 17185 | 54176 | |
Assoc. Degree | 495 | 4713 | 16025 | |
Bachelors Degree | 746 | 6154 | 26525 | |
Higher Degree | 155 | 2545 | 14248 | |
Total Housing Units | 4,810 | 41,164 | 120,466 | |
--Owner-Occupied | 2,314 | 20,320 | 66,955 | |
--Renter-Occupied | 1,607 | 13,895 | 37,938 | |
Owner-Occupied Values | < 100K | 1411 | 10154 | 23031 |
100-199K | 810 | 8230 | 31885 | |
200-299K | 64 | 1465 | 9171 | |
300-399K | 3 | 269 | 1775 | |
400-499K | 0 | 52 | 423 | |
500K+ | 26 | 149 | 670 | |
Total Working Age Population | 8,951 | 76,189 | 228,754 | |
In Work Force | 5,236 | 45,306 | 142,966 | |
Not In Work Force | 3,715 | 30,883 | 85,788 | |
Workforce Employed | 4,527 | 39,437 | 125,883 | |
Workforce Unemployed | 706 | 5,854 | 17,059 | |
Civlian Workforce | 5,233 | 45,290 | 142,942 | |
Military Workforce | 3 | 16 | 24 | |
Total Households | 3,921 | 34,215 | 104,893 | |
Family Households | 2,501 | 21,455 | 67,504 | |
Non-Family Households | 1,419 | 12,760 | 37,389 | |
Married Couple | 1,279 | 10,812 | 35,741 | |
Other Family | 1,222 | 10,643 | 31,764 | |
Married w/Child | 587 | 4,221 | 12,860 | |
Single Male w/Child | 119 | 1,053 | 2,596 | |
Single Female w/Child | 566 | 3,865 | 12,128 |
Population Change Last Two Decades - Plus Projection
2000 | % | 2010 | % | 2020 | % | 2030 | |
---|---|---|---|---|---|---|---|
Illinois | 12,419,293 | +3 | 12,830,632 | +12 | 14,316,487 | +6 | 15,138,849 |
Cook County | 5,376,741 | -3 | 5,194,675 | +10 | 5,707,832 | +5 | 5,990,243 |
Will County | 502,266 | +35 | 677,560 | +34 | 907,625 | +20 | 1,093,207 |
Total Working Age Population:
Total Households:
Total Working Age Population:
Total Households:
Total Working Age Population:
Total Households: