Industrial Properties
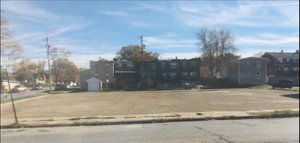
2701 Manokin Street Baltimore, MD 21230
2701 Manokin Street Baltimore, MD 21230

Details & Description
Listing Agents

Gary Glover
O: 410-578-1300
M: 443-629-2133
gary@goldcommercial.net
O: 410-578-1300
M: 443-629-2133
gary@goldcommercial.net
While we strive to provide the most accurate information, all listing information, and demographic data, is provided by third-parties. As such, MyEListing will not be responsible for the accuracy of the information. It is strongly recommended that you verify all information with the listing agent, and any relevant agencies, prior to making any decisions.