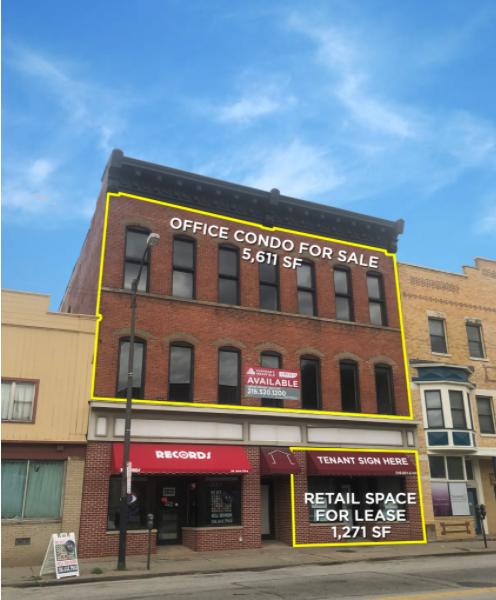
1-Mile | 3-Miles | 5-Miles | ||
---|---|---|---|---|
Total Population | 17,157 | 126,396 | 304,013 | |
Population Median Age | 37 | 36 | 38 | |
Population by Age | 0-9 Yrs | 1943 (11%) | 15864 (12%) | 34875 (11%) |
10-19 Yrs | 1546 (9%) | 13981 (11%) | 34316 (11%) | |
20-29 Yrs | 3172 (18%) | 25854 (20%) | 55474 (18%) | |
30-39 Yrs | 3210 (18%) | 19848 (15%) | 46288 (15%) | |
40-49 Yrs | 2025 (11%) | 15187 (12%) | 35175 (11%) | |
50-59 Yrs | 2330 (13%) | 15857 (12%) | 39686 (13%) | |
60-69 Yrs | 1811 (10%) | 11200 (8%) | 32862 (10%) | |
70+ Yrs | 1119 (6%) | 8604 (6%) | 25337 (8%) | |
Median HH Income | $37,273 | $33,886 | $36,698 | |
Total Household Income | < 24K | 3101 (37%) | 22337 (39%) | 50865 (36%) |
25-49K | 1777 (21%) | 14313 (25%) | 35987 (25%) | |
50-74K | 1192 (14%) | 8177 (14%) | 22128 (15%) | |
75-99K | 820 (9%) | 4642 (8%) | 12204 (8%) | |
100-199K | 977 (11%) | 5316 (9%) | 14384 (10%) | |
200K+ | 365 (4%) | 1713 (3%) | 3577 (2%) | |
Highest Education Level | No Diploma | 2498 | 17930 | 37197 |
Diploma or GED | 3065 | 24609 | 62583 | |
Some College | 2314 | 17189 | 45254 | |
Assoc. Degree | 637 | 5342 | 14510 | |
Bachelors Degree | 2277 | 12504 | 32542 | |
Higher Degree | 1890 | 8270 | 19009 | |
Total Housing Units | 10,076 | 66,877 | 162,869 | |
--Owner-Occupied | 2,812 | 17,178 | 54,660 | |
--Renter-Occupied | 5,421 | 39,320 | 84,485 | |
Owner-Occupied Values | < 100K | 1224 | 10544 | 32508 |
100-199K | 659 | 3432 | 15613 | |
200-299K | 502 | 1510 | 3270 | |
300-399K | 294 | 875 | 1524 | |
400-499K | 65 | 277 | 637 | |
500K+ | 68 | 539 | 1109 | |
Total Working Age Population | 14,123 | 102,296 | 248,636 | |
In Work Force | 8,991 | 62,398 | 156,202 | |
Not In Work Force | 5,132 | 39,899 | 92,434 | |
Workforce Employed | 8,202 | 55,609 | 140,449 | |
Workforce Unemployed | 789 | 6,740 | 15,654 | |
Civlian Workforce | 8,991 | 62,349 | 156,103 | |
Military Workforce | 0 | 49 | 99 | |
Total Households | 8,233 | 56,498 | 139,145 | |
Family Households | 3,310 | 24,460 | 62,173 | |
Non-Family Households | 4,923 | 32,038 | 76,972 | |
Married Couple | 1,665 | 11,410 | 31,804 | |
Other Family | 1,645 | 13,050 | 30,370 | |
Married w/Child | 593 | 4,018 | 11,273 | |
Single Male w/Child | 234 | 1,334 | 2,954 | |
Single Female w/Child | 650 | 6,574 | 14,240 |
Population Change Last Two Decades - Plus Projection
2000 | % | 2010 | % | 2020 | % | 2030 | |
---|---|---|---|---|---|---|---|
Ohio | 11,353,140 | +2 | 11,536,504 | 0 | 11,574,870 | 0 | 11,615,100 |
Cuyahoga County | 1,393,978 | -8 | 1,280,122 | -6 | 1,209,550 | -5 | 1,154,210 |
Total Working Age Population:
Total Households:
Total Working Age Population:
Total Households:
Total Working Age Population:
Total Households: