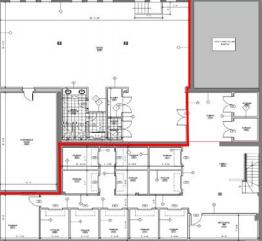
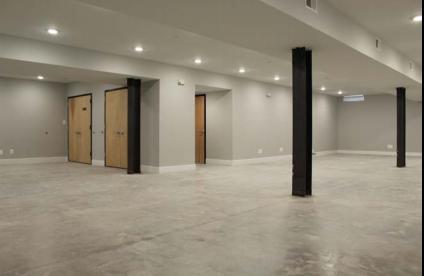
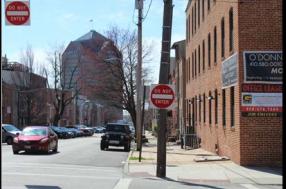
1-Mile | 3-Miles | 5-Miles | ||
---|---|---|---|---|
Total Population | 34,373 | 184,998 | 478,408 | |
Population Median Age | 35 | 36 | 37 | |
Population by Age | 0-9 Yrs | 3676 (10%) | 21665 (11%) | 59454 (12%) |
10-19 Yrs | 1325 (3%) | 16097 (8%) | 52817 (11%) | |
20-29 Yrs | 8736 (25%) | 38627 (20%) | 85103 (17%) | |
30-39 Yrs | 9559 (27%) | 38351 (20%) | 82257 (17%) | |
40-49 Yrs | 3662 (10%) | 19987 (10%) | 52322 (10%) | |
50-59 Yrs | 3188 (9%) | 20865 (11%) | 59714 (12%) | |
60-69 Yrs | 2137 (6%) | 16756 (9%) | 49619 (10%) | |
70+ Yrs | 2091 (6%) | 12651 (6%) | 37120 (7%) | |
Median HH Income | $106,932 | $64,044 | $52,867 | |
Total Household Income | < 24K | 1679 (10%) | 18103 (23%) | 49735 (26%) |
25-49K | 1938 (12%) | 13920 (17%) | 40815 (21%) | |
50-74K | 2220 (14%) | 11941 (15%) | 30438 (16%) | |
75-99K | 1579 (10%) | 8082 (10%) | 20743 (10%) | |
100-199K | 5025 (32%) | 16951 (21%) | 34814 (18%) | |
200K+ | 3175 (20%) | 8461 (10%) | 12542 (6%) | |
Highest Education Level | No Diploma | 2650 | 19546 | 52488 |
Diploma or GED | 3312 | 31913 | 100173 | |
Some College | 2454 | 19194 | 58800 | |
Assoc. Degree | 789 | 4901 | 15400 | |
Bachelors Degree | 9607 | 31686 | 56916 | |
Higher Degree | 8978 | 28149 | 49063 | |
Total Housing Units | 18,072 | 93,257 | 232,669 | |
--Owner-Occupied | 9,067 | 35,390 | 89,049 | |
--Renter-Occupied | 6,549 | 42,067 | 100,037 | |
Owner-Occupied Values | < 100K | 491 | 7265 | 19808 |
100-199K | 1465 | 9380 | 33749 | |
200-299K | 2774 | 7067 | 18268 | |
300-399K | 1788 | 4943 | 7973 | |
400-499K | 1082 | 2612 | 3707 | |
500K+ | 1467 | 4123 | 5544 | |
Total Working Age Population | 29,843 | 153,138 | 388,432 | |
In Work Force | 23,940 | 103,052 | 246,408 | |
Not In Work Force | 5,904 | 50,086 | 142,024 | |
Workforce Employed | 23,224 | 96,825 | 227,609 | |
Workforce Unemployed | 616 | 5,835 | 18,135 | |
Civlian Workforce | 23,840 | 102,660 | 245,744 | |
Military Workforce | 100 | 392 | 664 | |
Total Households | 15,615 | 77,457 | 189,087 | |
Family Households | 6,264 | 34,098 | 94,889 | |
Non-Family Households | 9,351 | 43,359 | 94,198 | |
Married Couple | 4,930 | 18,988 | 48,629 | |
Other Family | 1,334 | 15,110 | 46,260 | |
Married w/Child | 1,591 | 6,141 | 16,577 | |
Single Male w/Child | 269 | 1,342 | 4,169 | |
Single Female w/Child | 304 | 6,033 | 18,097 |
Population Change Last Two Decades - Plus Projection
2000 | % | 2010 | % | 2020 | % | 2030 | |
---|---|---|---|---|---|---|---|
Maryland | 5,296,486 | +9 | 5,773,552 | +6 | 6,141,900 | +6 | 6,518,750 |
Anne Arundel County | 489,656 | +10 | 537,656 | +7 | 573,250 | +4 | 596,700 |
Baltimore County | 754,292 | +7 | 805,029 | +5 | 847,000 | +2 | 862,200 |
Harford County | 218,590 | +12 | 244,826 | +5 | 257,700 | +5 | 271,850 |
Baltimore city | 651,154 | -5 | 620,961 | -1 | 616,300 | +1 | 625,100 |
Total Working Age Population:
Total Households:
Total Working Age Population:
Total Households:
Total Working Age Population:
Total Households: