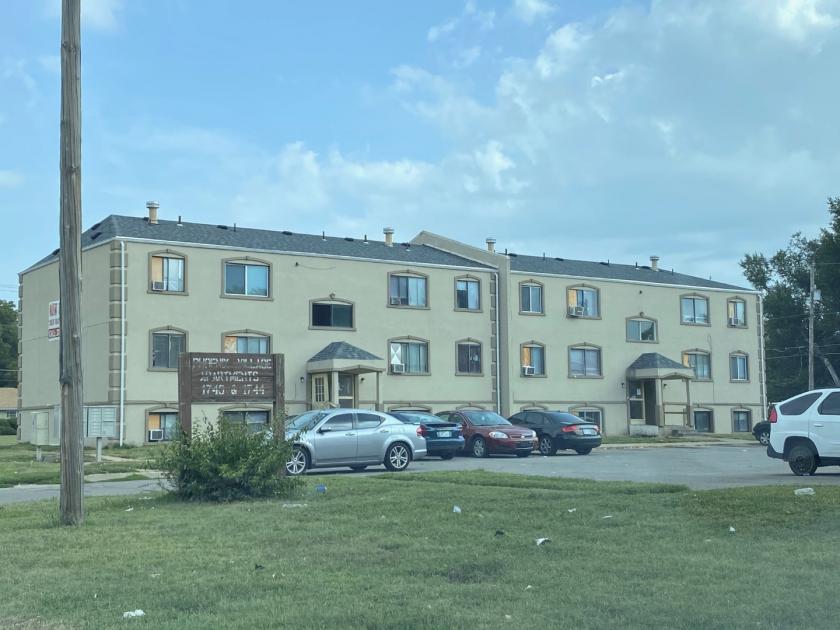
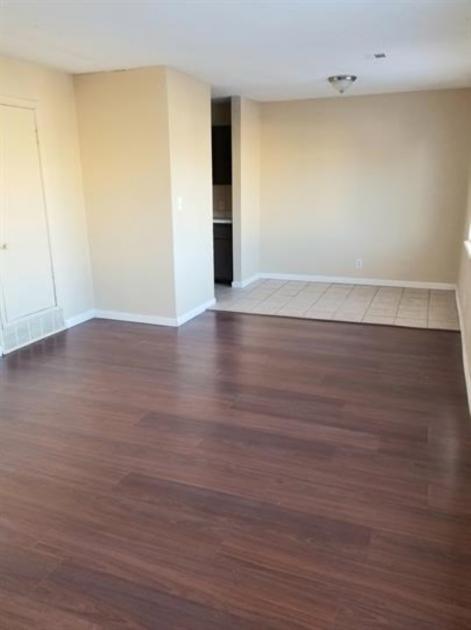
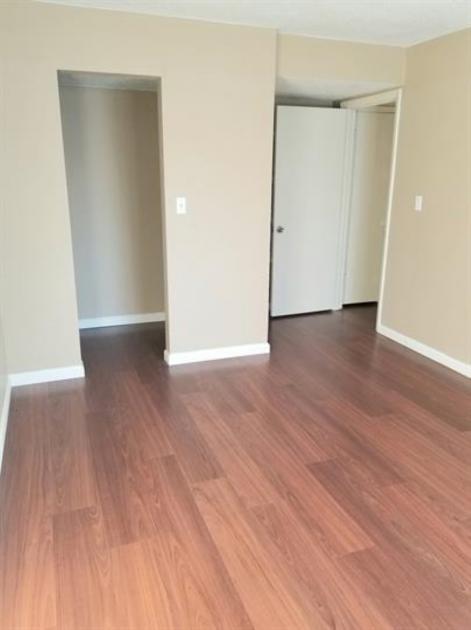
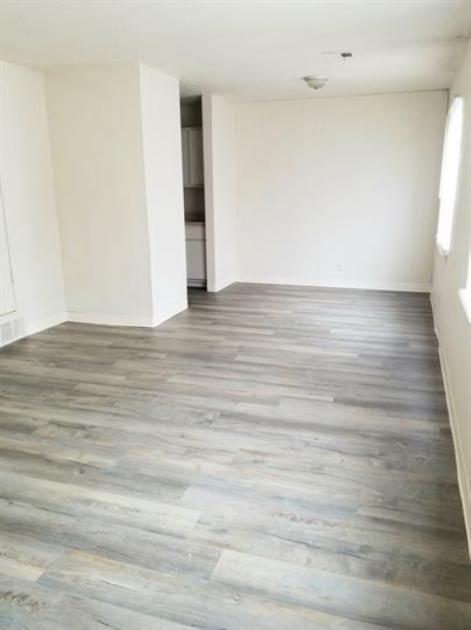
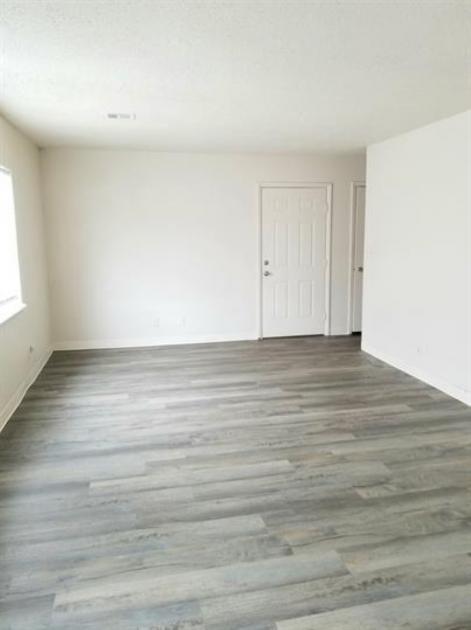
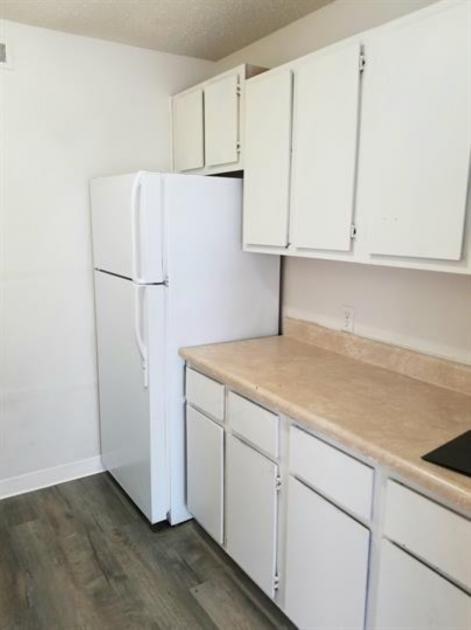
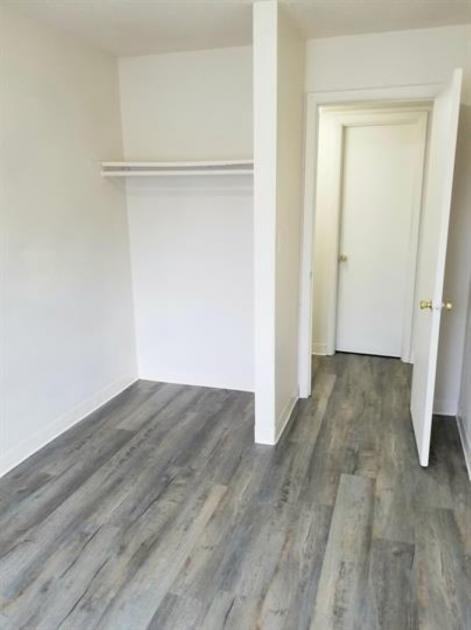
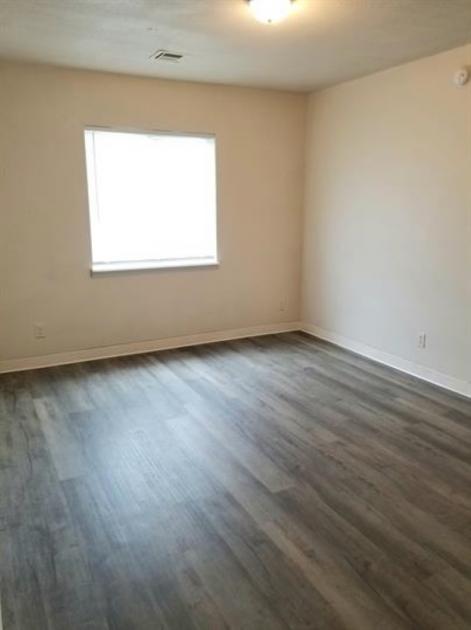
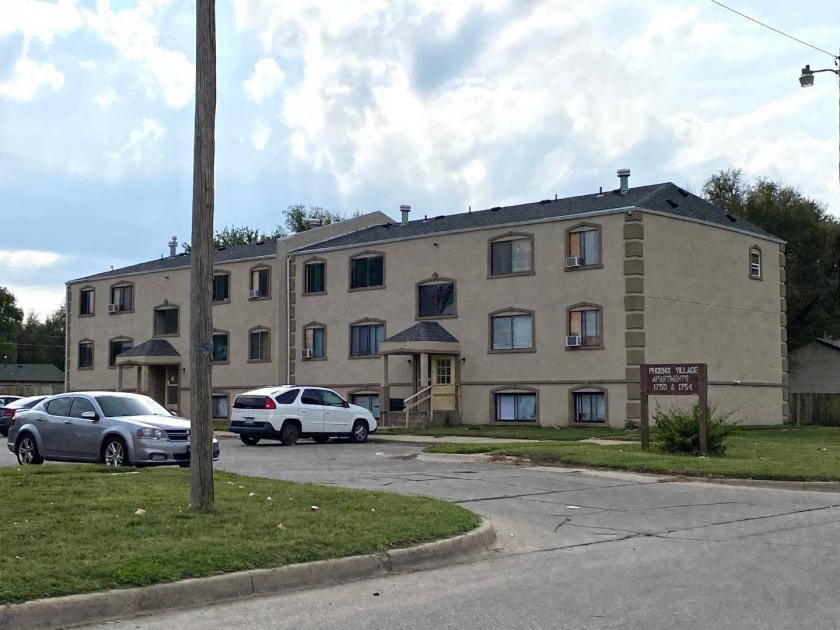
Great investment opportunity! Over 90% occupied and ready to make you money! All 24 units are 3 bedrooms putting them at $40.6K a unit! Over the last 2-3 years 40K worth of make ready repairs have been made including water heaters, air conditioners, plumbing, electrical, and more. Currently at a gross yearly income of $131,460 with the opportunity of $144,000 at full capacity. Owner owns all appliances at the moment including window units. Tenants pay gas, electric, and $30 water fee. Owner pays water and trash as well as lawn maintenance. Parking is paved and provides 1 spot per unit as well as street parking.Preapproval/POF required for showings, common and vacant units shown only. Title company to be Kansas Secured Title. Current PM company charges $30/mo water charge but owner pays the water bill. Tenants responsible for window units, all current units are owned by owner. Each unit has its own gas powered furnace. Owner owns all appliances. Selling agent responsible for personally verifying schools, measurements, and tax information. Please submit all offers to HollyHaws@kw.com. Escrow Instructions: Buyer and Seller understand Earnest Money will be held by Buyer Representative until offer acceptance by all parties. Within 5 business days of Effective date, Buyers Representative will deliver earnest money to Escrow Agent.