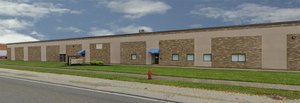
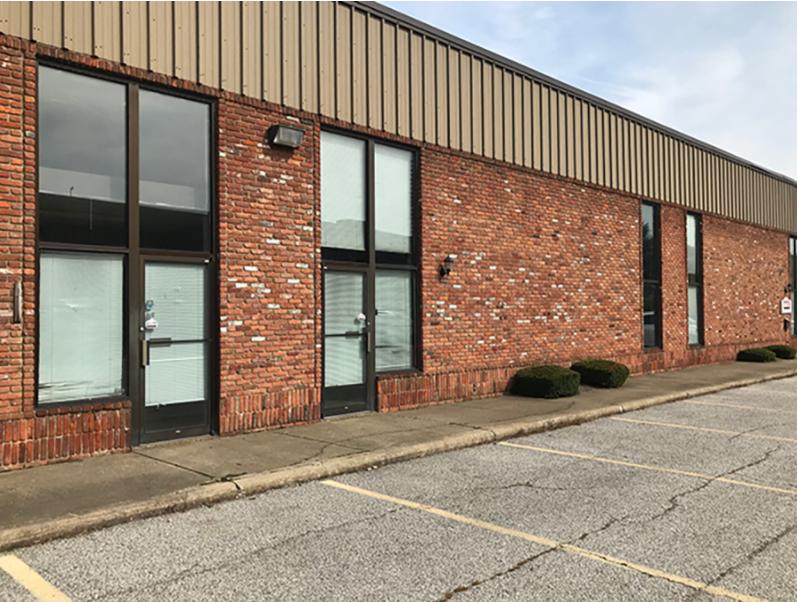
1-Mile | 3-Miles | 5-Miles | ||
---|---|---|---|---|
Total Population | 2,549 | 51,228 | 186,108 | |
Population Median Age | 42 | 40 | 41 | |
Population by Age | 0-9 Yrs | 252 (9%) | 6114 (11%) | 20885 (11%) |
10-19 Yrs | 274 (10%) | 6174 (12%) | 22326 (11%) | |
20-29 Yrs | 324 (12%) | 6168 (12%) | 22743 (12%) | |
30-39 Yrs | 340 (13%) | 6315 (12%) | 21528 (11%) | |
40-49 Yrs | 288 (11%) | 6308 (12%) | 22827 (12%) | |
50-59 Yrs | 350 (13%) | 7639 (14%) | 27376 (14%) | |
60-69 Yrs | 417 (16%) | 6733 (13%) | 25271 (13%) | |
70+ Yrs | 304 (11%) | 5777 (11%) | 23151 (12%) | |
Median HH Income | $48,658 | $49,206 | $44,621 | |
Total Household Income | < 24K | 209 (17%) | 4907 (22%) | 21703 (27%) |
25-49K | 388 (33%) | 6016 (27%) | 21784 (27%) | |
50-74K | 215 (18%) | 4430 (20%) | 14274 (18%) | |
75-99K | 138 (11%) | 2468 (11%) | 8400 (10%) | |
100-199K | 186 (15%) | 3210 (14%) | 11023 (13%) | |
200K+ | 32 (2%) | 547 (2%) | 2050 (2%) | |
Highest Education Level | No Diploma | 113 | 3484 | 15032 |
Diploma or GED | 596 | 13391 | 46411 | |
Some College | 542 | 8866 | 32275 | |
Assoc. Degree | 222 | 3150 | 11508 | |
Bachelors Degree | 233 | 4640 | 17324 | |
Higher Degree | 111 | 2470 | 9186 | |
Total Housing Units | 1,325 | 24,313 | 92,793 | |
--Owner-Occupied | 776 | 14,269 | 50,343 | |
--Renter-Occupied | 393 | 7,310 | 28,891 | |
Owner-Occupied Values | < 100K | 464 | 9137 | 29002 |
100-199K | 207 | 2873 | 13551 | |
200-299K | 64 | 1398 | 4781 | |
300-399K | 28 | 481 | 1663 | |
400-499K | 7 | 244 | 657 | |
500K+ | 5 | 137 | 689 | |
Total Working Age Population | 2,121 | 41,691 | 151,976 | |
In Work Force | 1,498 | 27,438 | 93,547 | |
Not In Work Force | 623 | 14,253 | 58,429 | |
Workforce Employed | 1,374 | 25,305 | 84,785 | |
Workforce Unemployed | 125 | 2,119 | 8,738 | |
Civlian Workforce | 1,498 | 27,423 | 93,523 | |
Military Workforce | 0 | 15 | 24 | |
Total Households | 1,168 | 21,579 | 79,233 | |
Family Households | 683 | 12,798 | 46,161 | |
Non-Family Households | 485 | 8,780 | 33,073 | |
Married Couple | 356 | 7,733 | 25,916 | |
Other Family | 327 | 5,065 | 20,245 | |
Married w/Child | 56 | 2,418 | 7,938 | |
Single Male w/Child | 34 | 481 | 1,649 | |
Single Female w/Child | 138 | 2,100 | 8,105 |
Population Change Last Two Decades - Plus Projection
2000 | % | 2010 | % | 2020 | % | 2030 | |
---|---|---|---|---|---|---|---|
Ohio | 11,353,140 | +2 | 11,536,504 | 0 | 11,574,870 | 0 | 11,615,100 |
Cuyahoga County | 1,393,978 | -8 | 1,280,122 | -6 | 1,209,550 | -5 | 1,154,210 |
Summit County | 542,899 | 0 | 541,781 | -1 | 534,150 | -1 | 528,990 |
Total Working Age Population:
Total Households:
Total Working Age Population:
Total Households:
Total Working Age Population:
Total Households: