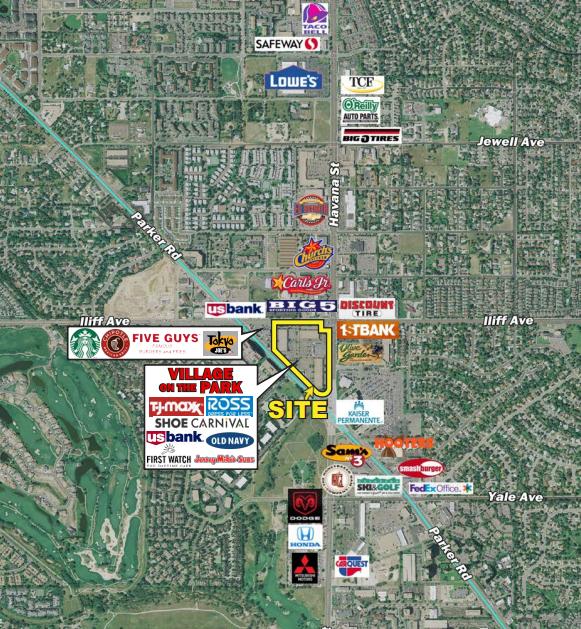
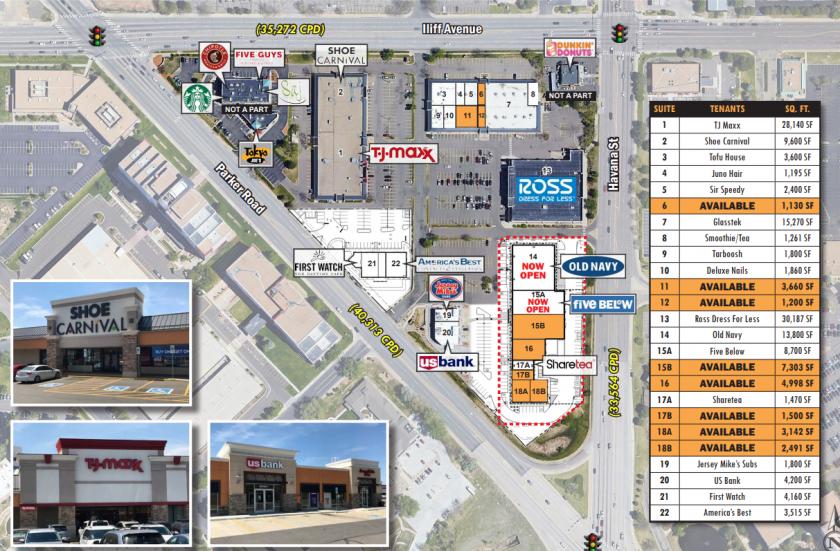
1-Mile | 3-Miles | 5-Miles | ||
---|---|---|---|---|
Total Population | 17,775 | 170,823 | 442,281 | |
Population Median Age | 40 | 39 | 37 | |
Population by Age | 0-9 Yrs | 1982 (11%) | 20699 (12%) | 54983 (12%) |
10-19 Yrs | 1485 (8%) | 16564 (9%) | 49577 (11%) | |
20-29 Yrs | 3269 (18%) | 28622 (16%) | 73395 (16%) | |
30-39 Yrs | 2525 (14%) | 27162 (15%) | 71655 (16%) | |
40-49 Yrs | 2319 (13%) | 22729 (13%) | 59138 (13%) | |
50-59 Yrs | 2357 (13%) | 18489 (10%) | 49976 (11%) | |
60-69 Yrs | 1946 (10%) | 17704 (10%) | 44372 (10%) | |
70+ Yrs | 1892 (10%) | 18856 (11%) | 39184 (8%) | |
Median HH Income | $59,438 | $58,287 | $63,914 | |
Total Household Income | < 24K | 1159 (14%) | 12746 (16%) | 27802 (15%) |
25-49K | 2205 (26%) | 18853 (25%) | 41378 (22%) | |
50-74K | 1483 (18%) | 15357 (20%) | 35334 (19%) | |
75-99K | 977 (11%) | 10658 (14%) | 24792 (13%) | |
100-199K | 1842 (22%) | 14075 (18%) | 37194 (20%) | |
200K+ | 505 (6%) | 3410 (4%) | 14146 (7%) | |
Highest Education Level | No Diploma | 733 | 10329 | 29083 |
Diploma or GED | 2446 | 25772 | 63757 | |
Some College | 2854 | 24880 | 60017 | |
Assoc. Degree | 1033 | 10147 | 23628 | |
Bachelors Degree | 4038 | 32397 | 81148 | |
Higher Degree | 1996 | 18709 | 49477 | |
Total Housing Units | 8,614 | 79,737 | 191,709 | |
--Owner-Occupied | 3,862 | 35,618 | 90,646 | |
--Renter-Occupied | 4,308 | 39,480 | 90,001 | |
Owner-Occupied Values | < 100K | 194 | 2018 | 3902 |
100-199K | 783 | 7608 | 13813 | |
200-299K | 922 | 10209 | 23307 | |
300-399K | 991 | 7253 | 18575 | |
400-499K | 566 | 4445 | 9962 | |
500K+ | 405 | 4085 | 21088 | |
Total Working Age Population | 14,877 | 139,621 | 356,277 | |
In Work Force | 11,102 | 98,438 | 253,814 | |
Not In Work Force | 3,775 | 41,183 | 102,463 | |
Workforce Employed | 10,589 | 93,901 | 241,812 | |
Workforce Unemployed | 478 | 4,261 | 11,381 | |
Civlian Workforce | 11,068 | 98,162 | 253,193 | |
Military Workforce | 34 | 276 | 622 | |
Total Households | 8,170 | 75,098 | 180,647 | |
Family Households | 3,885 | 37,805 | 99,466 | |
Non-Family Households | 4,285 | 37,293 | 81,181 | |
Married Couple | 2,715 | 25,402 | 69,500 | |
Other Family | 1,169 | 12,403 | 29,966 | |
Married w/Child | 1,068 | 10,417 | 30,063 | |
Single Male w/Child | 136 | 1,561 | 4,015 | |
Single Female w/Child | 443 | 4,729 | 10,834 |
Population Change Last Two Decades - Plus Projection
2000 | % | 2010 | % | 2020 | % | 2030 | |
---|---|---|---|---|---|---|---|
Colorado | 4,301,261 | +17 | 5,029,196 | +16 | 5,838,181 | +15 | 6,733,658 |
Adams County | 363,857 | +21 | 441,603 | +20 | 530,680 | +21 | 642,318 |
Arapahoe County | 487,967 | +17 | 572,003 | +16 | 662,304 | +13 | 750,773 |
Denver County | 554,636 | +8 | 600,158 | +23 | 738,611 | +12 | 827,681 |
Total Working Age Population:
Total Households:
Total Working Age Population:
Total Households:
Total Working Age Population:
Total Households: