Industrial Properties
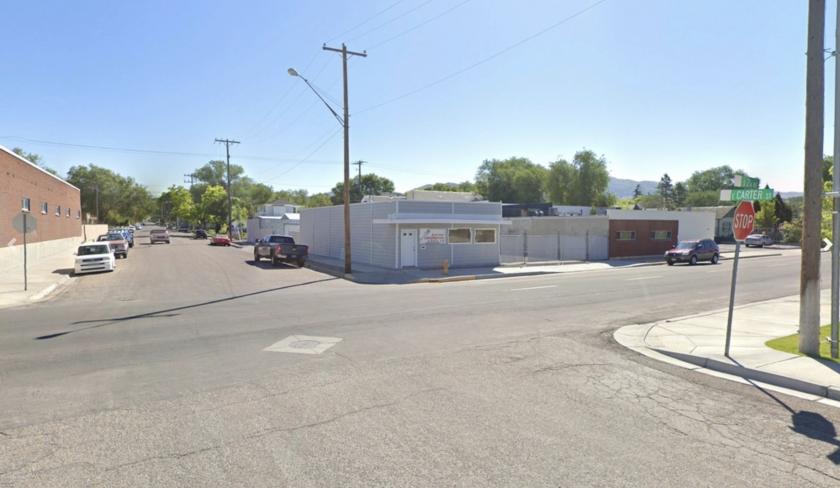
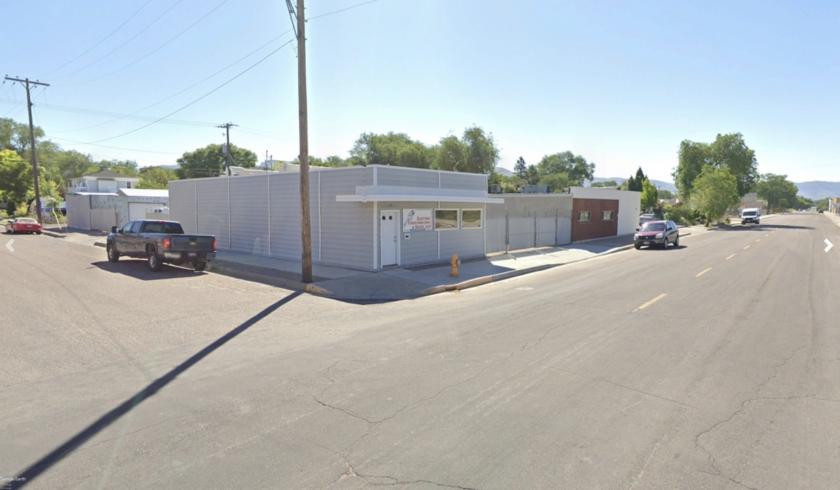
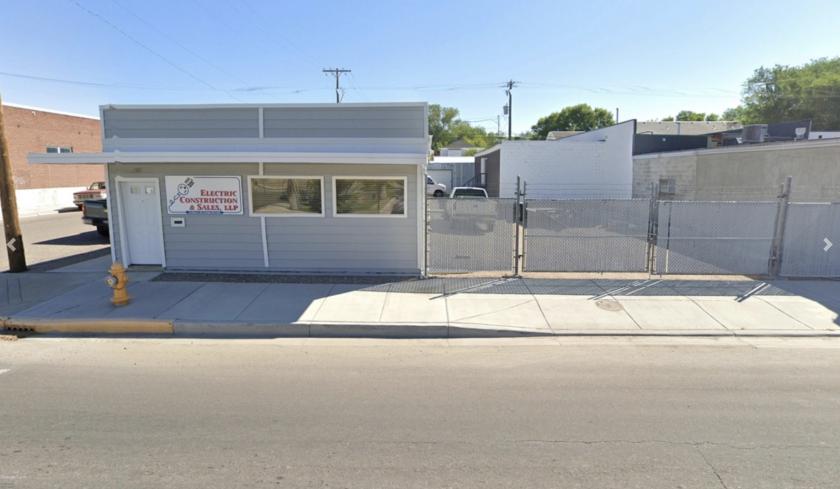
708 South 2nd Avenue Pocatello, ID 83201
708 South 2nd Avenue Pocatello, ID 83201
Details & Description
Listing Agents

BRENT WILSON
O: 208-656-2270
brent@tokcommercial.com
O: 208-656-2270
brent@tokcommercial.com
While we strive to provide the most accurate information, all listing information, and demographic data, is provided by third-parties. As such, MyEListing will not be responsible for the accuracy of the information. It is strongly recommended that you verify all information with the listing agent, and any relevant agencies, prior to making any decisions.